Executive Summary: A Market at a Crossroads
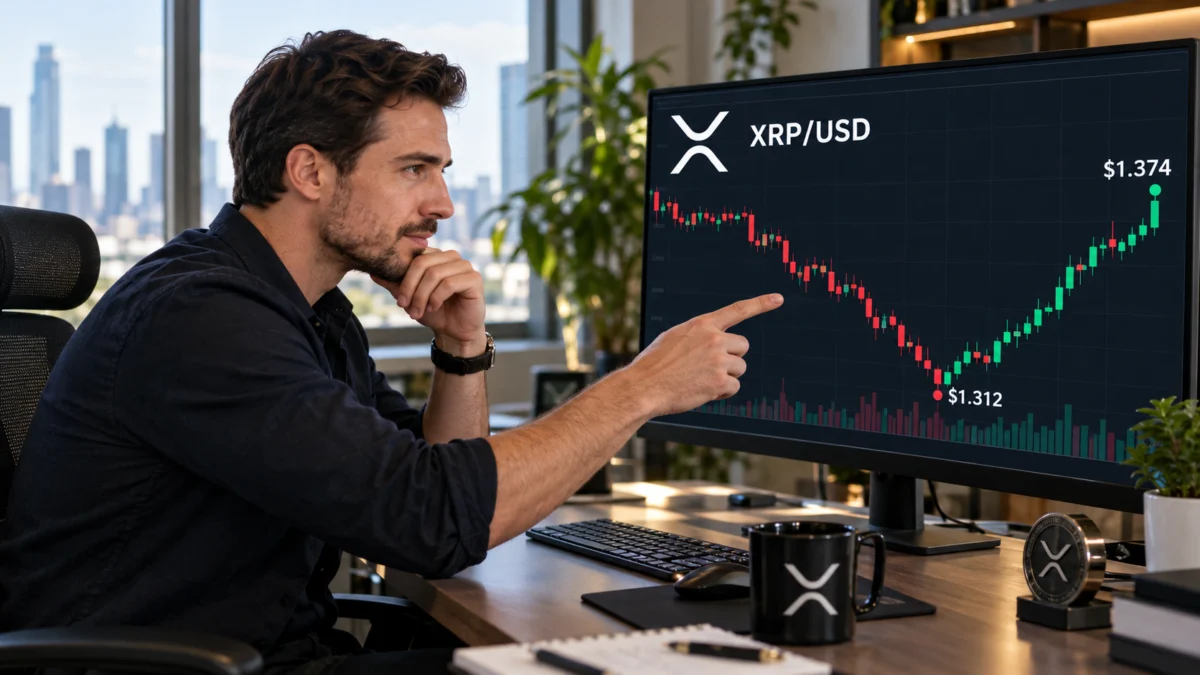
XRP, the native digital asset of the XRP Ledger, has recently entered a period of consolidation following a volatile start to the week. As of Tuesday, the token was trading in the vicinity of $1.374, attempting to carve out a support base after a sharp pullback on Monday. While derivatives data suggests a slight tilt toward bullish sentiment among speculative traders, the broader technical landscape remains cautious.
The current market environment is characterized by a "wait-and-see" approach, as participants weigh improved long-to-short ratios against the sobering reality of overhead resistance and lackluster momentum indicators. This article examines the intricate dance between market psychology and technical structure, exploring what the current data implies for XRP’s near-term price action.
Chronology of the Recent Pullback
To understand the current state of XRP, one must look at the timeline of the recent market movements.
- The Early Week Correction: After experiencing a period of renewed optimism, XRP faced a significant wave of selling pressure on Monday. This pullback served to shake out over-leveraged positions and test the resolve of retail holders.
- The Tuesday Stabilization: Tuesday saw a modest recovery. Traders began to reposition, and the intense selling pressure seen the previous day evaporated, allowing for a degree of price stabilization near the $1.37 mark.
- The Current Phase: As of today, the market is locked in a tug-of-war. The asset is oscillating between its primary moving averages, attempting to find a directional bias that has been absent for the better part of the week.
Supporting Data: Dissecting the Derivatives Landscape
The dichotomy between the long-to-short ratios and the funding rates provides the most compelling narrative regarding current market sentiment.
The Bullish Tilt in Positioning
According to data from CoinGlass, the long-to-short ratio for XRP stood at 1.09 on Tuesday. In the language of crypto-derivatives, a reading above 1.0 indicates that long positions—bets that the price will rise—outnumber short positions. This suggests that a plurality of market participants are positioning themselves for a potential upside move, reflecting a degree of fundamental confidence in the asset’s recovery.
The Funding Rate Paradox
However, this bullish tilt is countered by the funding rate, which dipped into negative territory at -0.0055%. In a perpetual futures market, a negative funding rate indicates that short sellers are effectively paying long traders to maintain their positions. This creates a paradox: while more traders are "going long" (the ratio), the market is still demonstrating a willingness to pay a premium to hold short positions (the funding rate). This suggests that while there is optimism, there is also significant hedging activity occurring, or perhaps a lack of conviction that the current price floor will hold.
Technical Analysis: The Battle of the Moving Averages
Technical analysts often refer to moving averages as the "gravity" of the market. Currently, XRP is caught in a gravitational pull between its 50-day, 100-day, and 200-day Exponential Moving Averages (EMAs).
The Overhead Hurdles
XRP is currently trading at $1.374, which places it in a precarious position just below its 200-day EMA ($1.381) and its 50-day EMA ($1.395). These two levels represent a "resistance cluster." Until the price can decisively break and hold above these averages, the short-term trend remains firmly bearish. For the bulls, reclaiming the $1.40 handle is not just a psychological victory; it is a structural necessity to signal a reversal of the current downtrend.
The Support Floor
Conversely, the 100-day EMA sits at $1.339, providing a vital line of defense for the bulls. If this level fails to hold, the next major psychological support lies at $1.300. Should a sustained breakdown occur below this level, technical analysts warn that the structural integrity of the recovery could be compromised, potentially opening the door for a retest of the $1.000 support zone.

Momentum Indicators
The Relative Strength Index (RSI) is currently hovering near 40. This is a "neutral-to-weak" zone; it indicates that the asset is not yet oversold, but it also lacks the buying momentum required to push prices into overbought territory. Coupled with a negative reading on the Moving Average Convergence Divergence (MACD) indicator, it becomes clear that the path of least resistance for XRP is currently downward or, at best, sideways.
Implications for Investors and Traders
The current market structure poses distinct challenges for different types of market participants.
For Short-Term Traders
The current environment is a classic "scalper’s market." With price action confined within a tight range of $1.339 to $1.395, traders are looking for confirmation of a breakout. The key takeaway for this cohort is to monitor the $1.381 and $1.395 levels. A failure to breach these suggests that "selling into strength" remains the dominant strategy for institutional players.
For Long-Term Holders
Long-term investors, often referred to as "HODLers," are likely looking beyond the noise of the funding rates. For this group, the primary focus is on the macro-utility of the XRP Ledger and the outcome of the ongoing regulatory developments that have historically shadowed the asset. The technical fluctuations seen this week are viewed as "market noise" rather than a fundamental shift in the asset’s value proposition.
Conclusion: The Road Ahead
The recovery of XRP remains in its infancy. While the modest rebound on Tuesday provided a glimmer of hope, the data clearly indicates that the market is not yet ready to mount a significant rally. The presence of negative funding rates despite a positive long-to-short ratio suggests that the market is cautious, and perhaps even skeptical, of the current price levels.
To break free from the current consolidation, XRP requires a fundamental catalyst—a surge in network activity, a favorable legal update, or a shift in the broader crypto market sentiment that allows Bitcoin and Ethereum to pull the rest of the sector upward. Until then, XRP remains tethered to its moving averages, waiting for the market to decide whether to reclaim the $1.671 and $1.900 resistance levels or retreat to test the $1.000 psychological support.
For now, the mantra for the XRP community remains one of vigilance. The derivatives data provides a map, but the price action will dictate the destination. Investors should remain mindful of the risks associated with the current technical setup and continue to monitor the volume and momentum indicators for signs of a definitive break in either direction.
Disclaimer: This article is for informational purposes only and does not constitute financial advice. Cryptocurrency investments carry high risk; consult with a professional financial advisor before making any investment decisions.