Executive Summary: A Historically Quiet Market
As the U.S. housing sector turns the page on 2025, analysts are grappling with a sobering reality: the market has reached a level of inactivity not seen in three decades. Data released by Calculated Risk indicates that 2025 likely concluded with the lowest volume of existing home sales since 1995. Even in the most optimistic scenarios—where final tallies might marginally edge out the 2024 figures—the combined volume of the last two years represents the most significant period of stagnation in the modern era, performing worse than even the depths of the 2008–2010 housing bust.
This report examines the early December data, the structural factors underpinning this downturn, and the broader economic implications of a market defined by high mortgage rates and a profound lack of inventory turnover.
Chronology: A Three-Decade Slide
To understand the gravity of the current situation, one must look at the historical context. The year 1995 serves as the benchmark for this "low-activity" era. For those who navigated the real estate landscape of the mid-90s, the experience was characterized by a lack of urgency; open houses were often lonely affairs, with real estate agents waiting hours for a single visitor.
The Arc of the Current Cycle
- The 2024–2025 Slump: After the post-pandemic frenzy, the market hit a brick wall. High interest rates, intended to curb inflation, effectively "froze" the market. Homeowners with 3% mortgage rates became "locked in," unwilling to trade their low monthly payments for current market rates.
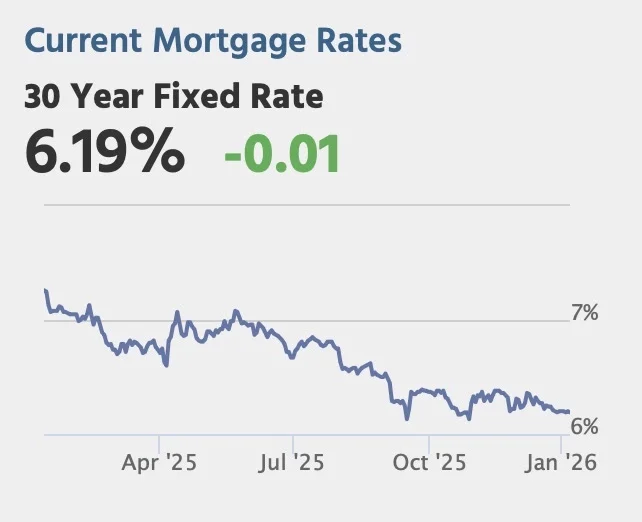
- October and November 2025: These months served as the bellwether for December closings. Mortgage rates averaged approximately 6.25% and 6.24% respectively. These rates continued to exert downward pressure on buyer affordability, keeping potential purchasers on the sidelines.
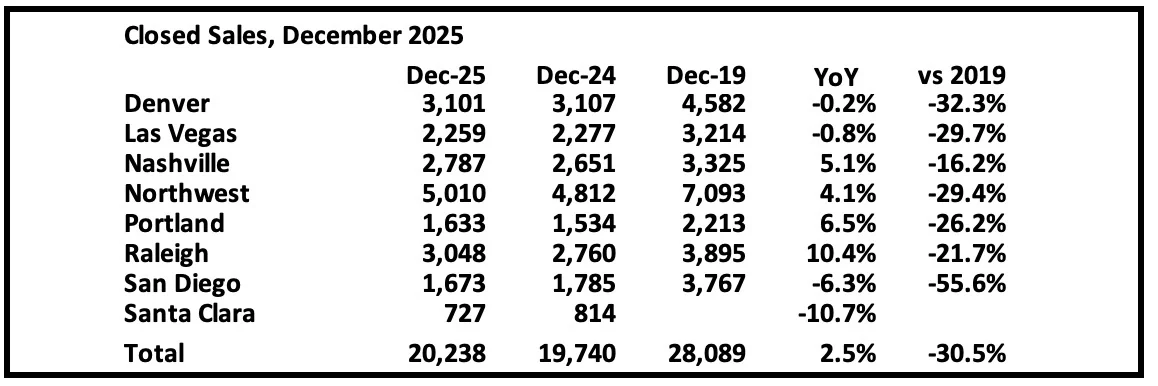
- December 2025 Early Reporting: Early data from local markets shows a 2.5% year-over-year (YoY) increase in sales. While this may appear to be a positive trend, it must be contextualized against the sharp 10.8% YoY decline observed in November.
Supporting Data: Parsing the December Numbers
The early December reporting, while offering a glimmer of movement, requires a nuanced interpretation. When evaluating housing market data, raw numbers can be misleading without adjusting for calendar effects.
The "Working Day" Variable
A critical factor in the December 2025 data is the calendar. December 2025 contained 22 working days, compared to 21 in December 2024. This extra day of activity naturally inflates the Not Seasonally Adjusted (NSA) data. Consequently, when the headline Seasonally Adjusted (SA) data is finalized, the reported year-over-year growth will likely be lower than the raw NSA figures suggest.
Mortgage Rate Correlations
The sales closed in December are primarily the result of contracts signed in October and November. With rates holding steady in the 6.2% range, the market is currently reflecting the behavior of buyers who have accepted the "new normal" of higher borrowing costs. However, the lack of inventory remains the primary constraint. Even if buyer demand were to tick upward, the chronic shortage of existing homes for sale prevents a meaningful recovery in transaction volume.
Official and Expert Perspectives
While official reports from the National Association of Realtors (NAR) are pending, independent analysts like Calculated Risk have been instrumental in framing the conversation. The consensus among market observers is that the "lock-in" effect—where homeowners refuse to list their properties because they cannot afford to purchase a new one at current rates—is the single most significant factor in this multi-year slump.
Economic Sentiment
Economists note that this is not a "crash" in the traditional 2008 sense. Unlike the housing bust, which was characterized by oversupply and subprime defaults, the current market is characterized by extreme scarcity. Borrowers today are generally well-qualified; they simply lack the incentive to move. This has led to a bifurcated market: those who must sell (due to life events like divorce or job relocation) and those who choose to wait.
Implications: What This Means for the Future
The implications of sustained low transaction volumes are far-reaching, affecting everything from real estate commission structures to the broader construction and banking sectors.

1. The Impact on Real Estate Services
With sales volume at a 30-year low, the real estate brokerage industry is facing a period of intense contraction. Agencies that flourished during the low-interest-rate era are finding it increasingly difficult to sustain operations. We are seeing a consolidation of firms and a shift toward more lean, technology-driven business models that do not rely on high-volume transactions to remain profitable.
2. The Construction and Home Improvement Sector
Because existing home sales are low, homeowners are choosing to "improve" rather than "move." This has bolstered the home renovation and remodeling industry, even as the brokerage side of the business suffers. Furthermore, homebuilders are attempting to fill the void left by the lack of existing inventory, though they struggle with land acquisition costs and labor shortages.
3. The "Locked-in" Homeowner and Monetary Policy
The Federal Reserve’s interest rate path remains the wildcard. Should rates drop significantly in 2026, we may see a sudden influx of inventory as "locked-in" homeowners finally feel empowered to move. However, if rates remain elevated, the market is poised to continue its trend of stagnation, where the only movement occurs at the margins of the market.
4. Societal and Demographic Effects
The inability for families to move easily has societal consequences. Increased geographic mobility is historically a driver of economic prosperity, allowing workers to move where jobs are most plentiful. When the housing market remains frozen, labor mobility decreases, potentially hindering long-term economic growth.
Conclusion: A Market in Search of Equilibrium
As we analyze the early data from December 2025, it is clear that the housing market is undergoing a period of structural recalibration. We are effectively living through a period of "suspended animation" in the real estate sector.
The comparison to 1995 is both instructive and cautionary. In 1995, the market was simply quiet; today, the market is constrained by a complex web of interest rate sensitivity and inventory hoarding. The 2.5% increase in early December data is a signal to watch, but it is unlikely to mark the beginning of a rapid recovery. Instead, the market will likely continue to drift in a narrow band, dictated by the persistent gap between what buyers can afford and what sellers are willing to accept.
As more local data rolls in throughout the coming weeks, the industry will gain a clearer picture of whether the final months of 2025 were a fluke of calendar adjustments or the first signs of a thawing market. For now, buyers and sellers alike remain in a "wait and see" pattern, watching the Fed and the mortgage rates with equal measure, hoping for the return of the liquidity that once defined the American real estate dream.
Final Outlook for 2026
The industry remains guarded. While the "worst" of the sales volume decline may be behind us, the path to a healthy, high-volume market is obstructed by the high cost of debt. Until the gap between current mortgage rates and the rates held by existing homeowners narrows, the "crickets" of the 1995-style market may continue to be the soundtrack of the 2026 real estate season.
Disclaimer: This analysis is based on preliminary local market reports and historical trend data provided by housing market analysts. Final national data may vary.