By Financial News Desk | January 12, 2026
The United States hospitality industry, which navigated a challenging and often stagnant performance landscape throughout 2025, has kicked off the new year with a notable uptick in key performance indicators. According to the latest data released by CoStar and STR, the week ending January 3, 2026, saw a year-over-year increase in hotel occupancy of 4.4%, offering a glimmer of optimism for stakeholders as they evaluate the trajectory for the coming fiscal year.
While industry analysts remain cautious about extrapolating too much from the first week of January—a period traditionally characterized by volatile travel patterns and post-holiday lulls—the data suggests that the sector is beginning to find firmer ground.
Main Facts: A Strong Start to the New Year
The data covering the week of December 28, 2025, through January 3, 2026, indicates a broad-based recovery across the primary metrics used to measure hotel health. The headline figure, a 4.4% increase in occupancy, brought the total U.S. hotel occupancy rate to 50.5%.
Beyond simple occupancy, the financial health of the sector appears to be strengthening. The Average Daily Rate (ADR) rose to $175.47, representing a 3.4% increase compared to the same period in the previous year. Perhaps most significantly, the Revenue per Available Room (RevPAR)—the industry’s most comprehensive metric for gauging operational success—climbed by 7.9% to reach $88.65.
This combination of rising occupancy and increased daily rates suggests that pricing power within the industry remains resilient. Despite the inflationary pressures that plagued the economy in 2025, travelers appear willing to pay a premium for lodging, a trend that could provide much-needed relief to hotel operators who have seen their margins squeezed by rising labor and maintenance costs over the past 24 months.
Chronology: From the 2025 Slump to 2026 Resurgence
To understand the significance of the 2026 opening figures, one must look back at the difficult performance metrics of 2025. Throughout the previous year, the hospitality sector faced a "softening" trend. High interest rates, a cooling labor market, and shifting consumer sentiment regarding discretionary spending led to a year of inconsistent performance.
The 2025 Context
For much of 2025, the industry struggled to maintain the post-pandemic momentum that characterized 2023 and early 2024. During the middle quarters of 2025, occupancy rates often hovered below expectations, and while ADR remained high, the volume of travelers did not always meet the capacity requirements of a growing inventory of new hotel builds.
The Year-End Turnaround
As the calendar turned toward the final quarter of 2025, signs of stabilization began to emerge. November and December saw a consolidation of demand, particularly in major urban centers and business travel hubs. The holiday season provided a necessary boost, leading into the first week of 2026. The 4.4% growth rate, while bolstered by favorable calendar alignment, marks the first meaningful break from the sluggish trends that defined the mid-to-late months of the previous year.
Supporting Data: Visualizing the Seasonal Shift
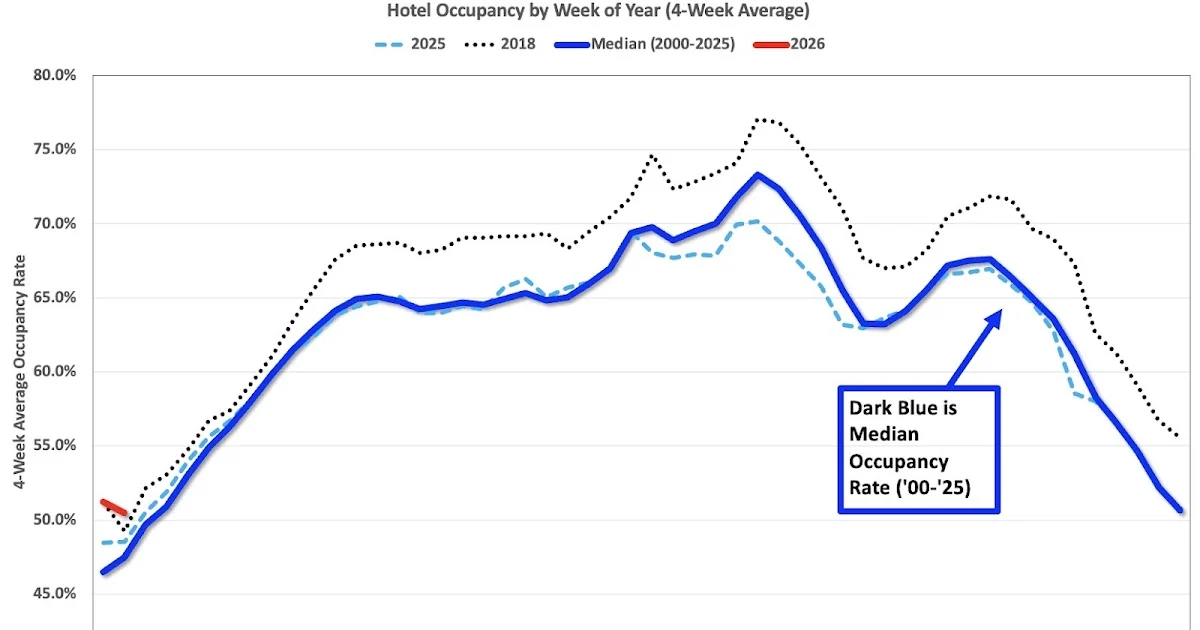
The industry’s performance is best understood through the lens of seasonality. STR data provides a "four-week average" model that smooths out the week-to-week volatility inherent in the travel industry.
In the analytical models provided by experts at Calculated Risk, the seasonal pattern for 2026 is currently being plotted against a "median" baseline and the historical record-setting year of 2018.
- The 2025 Baseline: The dashed light blue line, representing 2025, shows a consistent drag on performance compared to the historical median.
- The 2018 Benchmark: The dashed black line representing 2018 remains the "gold standard" for the industry. While current 2026 levels (represented in red) remain below the 2018 peak, the current trajectory is trending toward convergence with historical averages.
- The Methodology Note: It is essential to note that the Y-axis on these performance graphs is intentionally truncated (not starting at zero). This is a standard industry practice to highlight the nuances of seasonal fluctuations that would otherwise be obscured by a wide-scale chart.
As we move through the first quarter of 2026, the four-week average is expected to climb seasonally. The true test of the industry’s health will arrive in late February and March, when business travel cycles and spring break tourism patterns fully engage.

Official Responses and Expert Outlook
Industry leaders and market observers have offered a tempered response to the early 2026 data. The consensus among financial analysts is that while the growth is positive, it is premature to declare a complete industry recovery.
"We are seeing a normalization of travel patterns," says one senior hospitality strategist. "The 4.4% increase is encouraging, but it needs to be weighed against the fact that early January is historically a low-occupancy period. We need to see if this RevPAR growth sustains itself through the second quarter before we can adjust our annual forecasts upward."
Many hotel chains have expressed confidence in the first-quarter performance, citing a surge in advance bookings for major conferences and events scheduled for the spring. However, labor shortages continue to be a primary concern. The ability of hotels to capitalize on higher occupancy depends heavily on their capacity to staff their facilities adequately, a challenge that remains a persistent thorn in the side of the service sector.
Implications: What This Means for the Economy
The hospitality sector serves as a bellwether for the broader U.S. economy. Because hotel stays are often one of the first discretionary expenses to be trimmed during an economic downturn, the uptick in occupancy provides several key insights:
1. Consumer Confidence
A rise in RevPAR and occupancy indicates that consumers still possess the disposable income necessary to prioritize travel. It suggests that, despite concerns regarding credit card debt and interest rates, the middle and upper-middle-class consumer segments remain active in the travel market.
2. The Business Travel Revival
The increase in ADR is a clear indicator that business travelers—the backbone of the hospitality industry—are returning to the road. Corporations appear to be loosening travel budgets, suggesting a stabilization in corporate profitability and a renewed focus on face-to-face networking.
3. Investment and Development
For real estate investors, the current data serves as a signal to hold or reinvest. If the 4.4% growth trend holds, we are likely to see an increase in the valuation of hotel assets and potentially a new wave of capital expenditure aimed at renovation and modernization of aging properties.
4. A Cautionary Note on Inflation
While revenue growth is positive for hotel owners, it is a double-edged sword for the consumer. Rising ADRs mean that the cost of travel is climbing. Should this trend continue, there is a risk that the "sticker shock" of travel costs could eventually dampen demand, potentially leading to a plateau in occupancy growth by the summer months.
Conclusion: Looking Ahead to the Second Quarter
As the industry navigates the remainder of the first quarter, stakeholders will be monitoring the gap between the 2026 red line and the 2018 benchmark. The goal for the industry is not just to match 2025, but to outpace it significantly to justify the high cost of debt and operational overheads currently affecting the sector.
Early January’s results are a promising start. They suggest that the "weakness" that plagued 2025 may have bottomed out, providing a foundation for growth. However, the industry is not yet in the clear. External macroeconomic factors—including potential shifts in interest rate policy and geopolitical impacts on travel—will play a defining role in the months ahead.
For now, the U.S. hotel industry remains in a state of cautious optimism. The 7.9% surge in RevPAR is the most compelling figure in the current report, signaling that while the volume of travelers is increasing, the value of those travelers to the industry is increasing even faster. Whether this trajectory represents a long-term recovery or a temporary seasonal anomaly remains the primary question for the first half of 2026.