Date: January 10, 2026
Subject: Market Correction and Sectoral Shifts in Real Estate
The U.S. residential real estate market has entered a period of recalibration as we move into the first quarter of 2026. Data released this week by the Calculated Risk research team highlights a multifaceted landscape defined by slowing construction starts, the effective evaporation of home equity extraction, and a notable pivot in rental market dynamics. As the economy navigates the complexities of the current fiscal cycle, these indicators provide a sobering look at a sector attempting to find equilibrium in an era of constrained liquidity and shifting consumer behavior.
Main Facts: The New Reality of Residential Construction
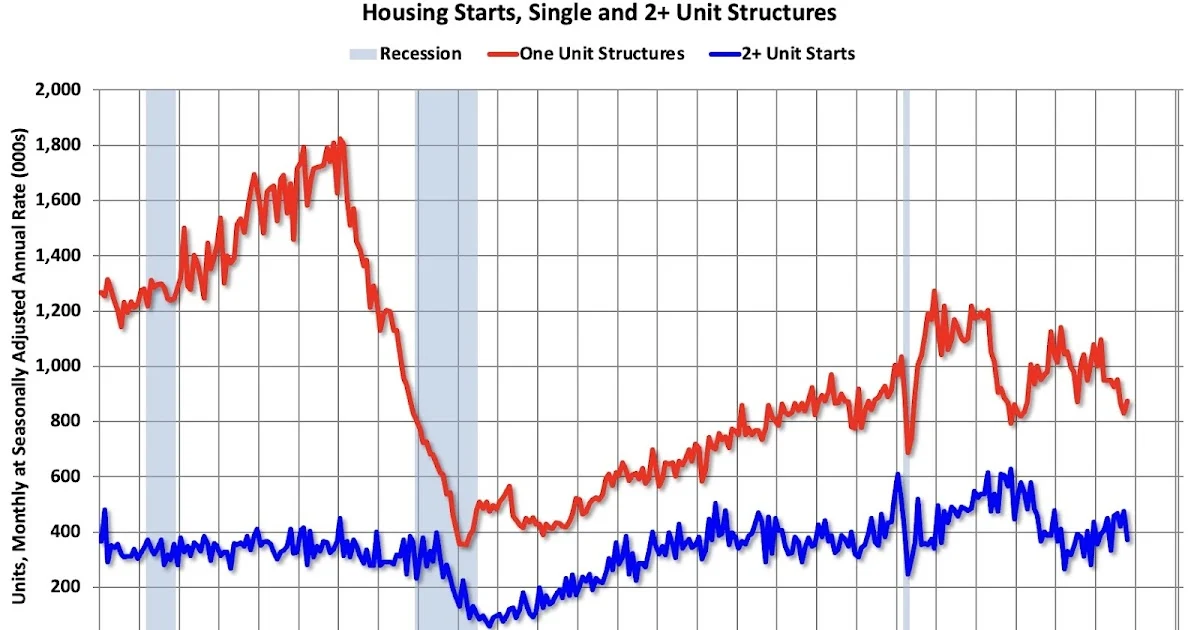
The most significant headline from the past week’s data is the decline in housing starts to a seasonally adjusted annual rate of 1.246 million units. This figure serves as a critical barometer for the health of the broader economy. Residential construction is historically a leading indicator, and the current deceleration reflects a confluence of high interest rates, elevated material costs, and a cautious outlook from developers.
While the appetite for new inventory remains theoretically high due to long-term demographic needs, the practical execution of new projects has hit a wall. Builders are increasingly risk-averse, focusing on completing existing projects rather than breaking ground on new developments. This strategy—often referred to as "finishing the pipeline"—is a defensive maneuver designed to protect balance sheets in an environment where the cost of capital remains prohibitively high for many mid-sized regional developers.
Chronology of Market Shifts: Q3 2025 through January 2026
To understand where we are, we must look at the timeline of the recent market transition:
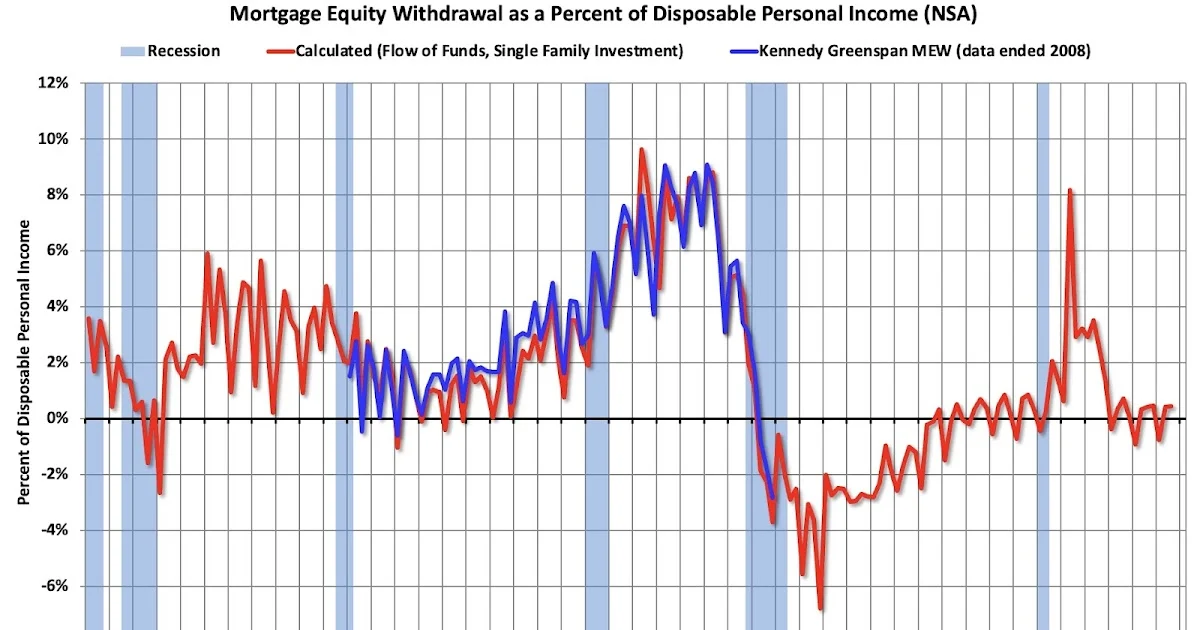
- Q3 2025 (The Turning Point): Data from late last year revealed that the "Home ATM"—the practice of utilizing cash-out refinances and home equity lines of credit (HELOCs) to fund consumption—had effectively closed. As mortgage rates stabilized at higher levels, the incentive for homeowners to tap into their equity vanished, signaling a contraction in household liquidity.
- October 2025: The groundwork for the current 1.246 million annual start rate was laid during the autumn months, as developers began to signal a pullback in multi-family permit applications.
- December 2025: Local housing markets across the country began to show signs of price fatigue. Inventory in key metropolitan areas started to linger longer on the market, ending the year with a noticeable shift in leverage from sellers to buyers.
- January 2026: The official release of the annual rate figures confirms that the anticipated "soft landing" in the housing sector is manifesting as a slow, grinding adjustment rather than a sharp correction.
Supporting Data: Deconstructing the Trends
The Calculated Risk newsletter analysis provides a granular look at the data points that define the current environment.
1. The "Home ATM" and Household Debt
For the better part of a decade, the appreciation of residential real estate acted as a secondary savings account for the American middle class. Through cash-out refinances, homeowners converted "paper wealth" into liquid cash. However, with the current interest rate environment, the math no longer supports this strategy. Debt-servicing costs now outweigh the benefits of pulling cash out of a home, forcing households to curtail discretionary spending. This is a massive shift in the consumer spending engine that has underpinned the U.S. economy for years.
2. Rental Market Retrenchment
Perhaps the most surprising development is the year-over-year decline in asking rents. For years, the narrative was one of relentless price growth in the rental sector. However, a significant influx of multi-family units, which began construction in the 2023-2024 boom, has finally hit the market. The resulting supply surplus is forcing landlords to compete for tenants, leading to the first sustained cooling in asking rents we have seen in several years.
3. The Housing Bubble and GDP
The relationship between mortgage debt and GDP is a key metric for long-term systemic stability. As total mortgage debt as a percentage of GDP stabilizes, it suggests that we are moving away from the leverage-fueled growth of the past. While this may feel like a slowdown, economists argue it is a necessary adjustment to prevent the kind of systemic over-leveraging that characterized the 2008 financial crisis.
Official Responses and Expert Sentiment
While official government responses to these figures remain measured, the broader financial community is expressing cautious optimism mixed with concern.
Institutional investors are closely watching the Calculated Risk metrics to determine when to re-enter the market. The consensus among analysts is that while the current numbers look "down," they represent a move toward a more sustainable, "fundamentals-driven" market.

"We are seeing the end of the ‘free money’ era in housing," says one senior analyst. "Developers are not failing; they are simply being forced to build to actual market demand rather than speculative demand."
Meanwhile, the National Association of Home Builders (NAHB) has consistently lobbied for relief in regulatory and supply chain costs, arguing that if the government wants to avoid a housing supply crunch, it must streamline the permitting process to lower the "barrier to entry" for new developments.
Implications for the Broader Economy
The ramifications of these trends extend far beyond the real estate industry.
Impact on Consumer Spending
With the "Home ATM" effectively closed, the "wealth effect"—the economic phenomenon where people feel richer and spend more because their homes have increased in value—is rapidly dissipating. This will likely lead to a tightening of consumer budgets in the first and second quarters of 2026. Retailers, automotive companies, and the travel sector should prepare for a consumer base that is increasingly focused on debt reduction rather than luxury spending.
Inflationary Pressures
The decline in asking rents is a positive sign for the Federal Reserve’s inflation targets. Since shelter costs are a massive component of the Consumer Price Index (CPI), a sustained cooling in rent growth is the single most effective way to bring headline inflation closer to the 2% target. If this trend continues throughout 2026, it could provide the Fed with the "room" to maneuver on interest rate policy.
The Construction Labor Market
The drop in housing starts to 1.246 million creates a potential bottleneck in the construction labor market. If developers continue to pause, skilled labor may begin to exit the industry, seeking more stable employment in infrastructure or commercial projects. This loss of human capital could create a "scarcity premium" for labor, making it significantly more expensive to restart large-scale residential projects when market conditions eventually improve.
Geographic Divergence
Finally, it is critical to note that the national averages mask a high degree of geographic variance. While the "sunbelt" markets that saw massive growth during 2021-2023 are experiencing the sharpest corrections, older, established urban centers are seeing a more stable, albeit slower, performance. Investors and homebuyers alike must look beyond the national headlines to understand the specific dynamics of their local markets.
Conclusion: Looking Ahead to Mid-2026
As we navigate the first half of 2026, the housing sector is undergoing a necessary, if painful, transition. The era of cheap debt and runaway equity extraction has concluded. In its place, we are seeing the emergence of a market defined by supply-side constraints and a fundamental recalibration of rental and purchase prices.
The Calculated Risk data underscores a vital truth: the real estate market is not a monolith. It is a complex ecosystem sensitive to interest rates, fiscal policy, and, most importantly, the ability of the average American household to sustain debt. The current 1.246 million annual start rate is not necessarily a sign of a crash, but rather a signal that the market is finding a new, more sustainable equilibrium.
For the remainder of the year, all eyes will be on whether the rental market cooling continues to dampen inflation, and whether the inevitable return of demand—driven by household formation—will be met by a construction industry that has the capacity to build, or if we are headed toward a long-term supply-demand imbalance that keeps housing prices stubbornly high despite the current slowdown. As always, the truth lies in the details of the next monthly report.