By Financial Analysis Desk
January 9, 2026
In the early 2000s, the American housing market was defined by a phenomenon that economists would later identify as a primary catalyst for the Great Recession: the "Home ATM." During this era, homeowners treated their properties as personal piggy banks, leveraging skyrocketing valuations to fund everything from home renovations to consumer luxuries. When the bubble burst, the lack of equity—and, in many cases, the prevalence of negative equity—left millions of households underwater.
As of the third quarter of 2025, however, the latest data from the Federal Reserve’s Financial Accounts of the United States (the Z.1 "Flow of Funds" report) suggests that this era of reckless extraction remains firmly in the rearview mirror. While mortgage debt continues to grow, it is doing so at a pace that suggests a fundamentally different, and arguably more cautious, consumer behavior.
Main Facts: A Steady Pulse in Mortgage Debt
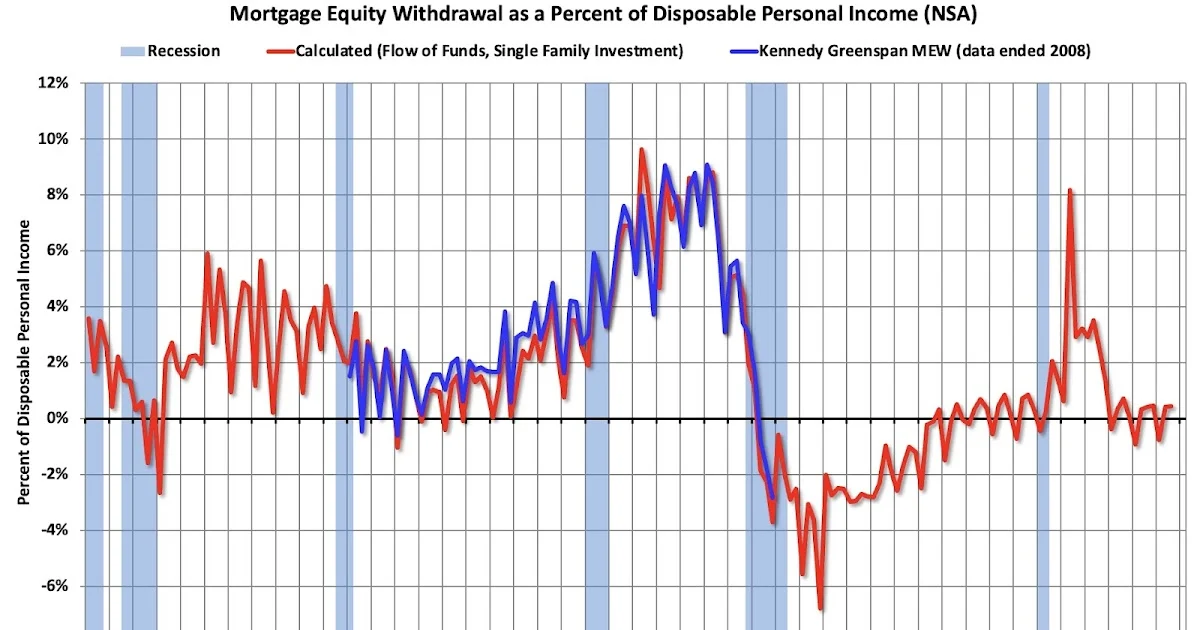
According to the Federal Reserve’s latest release, mortgage debt increased by $108 billion during the third quarter of 2025. Notably, this figure remains unchanged from the growth seen in the second quarter of the same year.
For observers of macroeconomic trends, this $108 billion figure serves as a vital barometer for the health of the housing market. However, it is essential to distinguish between "new debt" and "Mortgage Equity Withdrawal" (MEW). A significant portion of this quarterly increase is driven by the financing of new housing stock—the construction and purchase of new homes—rather than the extraction of equity from existing homes to fund non-housing consumption.
The "Home ATM" effectively closed during the years following the 2008 financial crisis. Between 2009 and 2016, the U.S. saw nearly seven years of sustained decline in total mortgage debt, a period marked by a painful deleveraging process. This was driven primarily by distressed sales, including foreclosures and short sales, which effectively "wiped out" vast swaths of household debt. The current environment, by contrast, shows a measured expansion of debt that is largely tied to capital investment in real estate rather than speculative consumption.
Chronology: From Bubble to Stability
To understand the significance of the Q3 2025 data, one must look at the historical trajectory of household debt in the United States.
The Era of Excess (2000–2006)
During the lead-up to the 2008 crash, the U.S. experienced an unprecedented surge in mortgage debt. Financial institutions, driven by low-interest rates and lax underwriting standards, encouraged homeowners to tap into their rising equity. This led to a feedback loop: home prices rose, equity increased, and that equity was immediately cashed out, fueling further price appreciation.
The Great Deleveraging (2007–2015)
The collapse of the housing bubble forced a decade-long correction. As home prices plummeted, millions of Americans found themselves with "underwater" mortgages. During this period, the net flow of mortgage debt was negative. Household balance sheets were repaired through the harsh mechanisms of default and liquidation. This period established a cultural and psychological shift regarding homeownership, with debt becoming something to be paid down rather than tapped into.
The New Normal (2016–Present)
Following the recovery, the housing market entered a phase of sustained, if tempered, growth. While interest rates fluctuated significantly, the appetite for "cashing out" equity has remained subdued compared to the mid-2000s. The Q3 2025 report confirms that while mortgage balances are climbing, the velocity of that climb is consistent with a market supported by fundamentals—population growth, new construction, and long-term asset appreciation—rather than the reckless borrowing that defined the pre-recession years.

Supporting Data: The Z.1 Report Breakdown
The Federal Reserve’s Z.1 report provides a comprehensive look at the "Flow of Funds," detailing how debt moves through the economy.
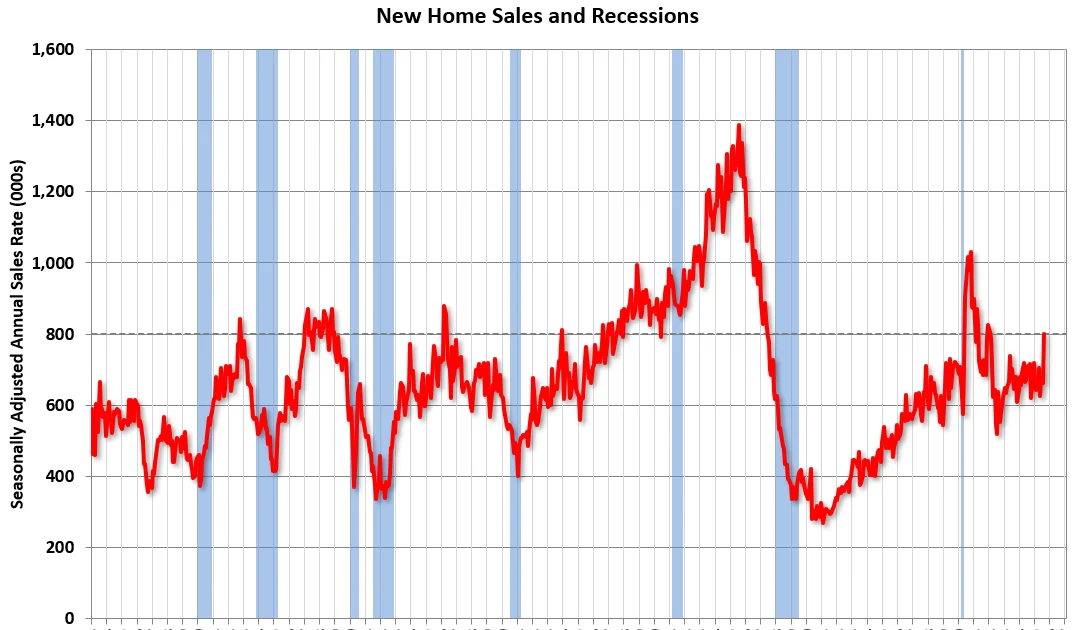
- Quarterly Growth: The $108 billion increase in Q3 2025 reflects a stable trajectory. Analysts note that this growth aligns with the current pace of new home starts and existing home sales prices.
- The Debt Composition: It is a common misconception to view any increase in mortgage debt as "equity withdrawal." In reality, a substantial slice of this debt is "productive debt"—mortgages taken out to acquire new property. When a builder constructs a new home and a buyer takes out a mortgage to purchase it, the total mortgage debt in the economy rises, but the net equity of the homeowner remains tied to the underlying asset value.
- The "Home ATM" Index: Economists often track the ratio of MEW to total mortgage growth. While exact quarterly figures for MEW are often lagged, the trend line suggests that homeowners are retaining equity at significantly higher rates than they did twenty years ago. The trauma of the 2008 collapse appears to have created a lingering "equity preference" among homeowners.
Official Responses and Expert Consensus
Market analysts and Federal Reserve officials have noted that the current mortgage debt levels, while rising, do not mirror the systemic risks of the mid-2000s.
"The housing market has fundamentally changed," says one senior financial analyst. "The lending standards established in the wake of the Dodd-Frank Act have made it much more difficult for homeowners to treat their homes as revolving credit lines. Today’s borrower is more likely to be an owner-occupant focused on long-term wealth accumulation rather than short-term liquidity extraction."
Furthermore, the Federal Reserve’s commentary on the Z.1 report emphasizes the importance of household net worth. Because home prices have remained relatively stable or have appreciated in a controlled manner in most markets, the "loan-to-value" (LTV) ratios across the national portfolio remain healthy. This creates a buffer, ensuring that even in the event of a minor market correction, the majority of homeowners would remain in positive equity territory.
Implications: What This Means for the Future
The fact that the "Home ATM" remains mostly closed has significant implications for the broader U.S. economy:
1. Increased Resilience to Economic Shocks
Because households are not leveraged to the hilt, they are less vulnerable to sudden dips in home prices. If the economy faces a recession, homeowners are less likely to be forced into fire-sales, which would prevent the kind of "cascading effect" that turned the 2008 downturn into a full-scale systemic collapse.
2. Slower Consumer Spending Growth
Conversely, the "closed ATM" means less cash flowing into the consumer economy. In the 2000s, homeowners used their home equity to buy cars, fund vacations, and pay for education. Today’s consumer must rely more on wages and credit cards. While this is less stimulating for short-term GDP, it is significantly more sustainable for household financial health.
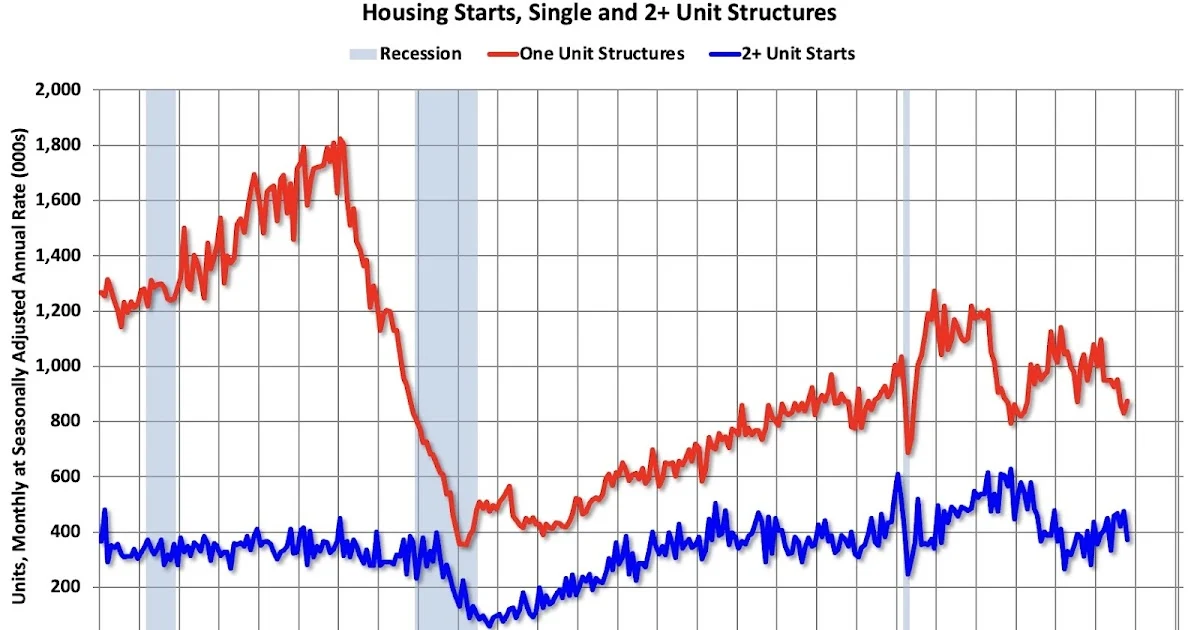
3. The Shift to New Construction
With the "Home ATM" closed, the growth in mortgage debt is increasingly tied to the expansion of the housing supply. This is a positive development for the long-term health of the U.S. housing market. By focusing debt on new stock rather than existing equity extraction, the financial system is incentivizing developers to address the ongoing housing shortage.
4. A More Cautious Housing Market
The psychological shift among Americans regarding home equity cannot be overstated. A generation of homeowners watched their parents lose their homes or face years of financial distress. This has created a bias toward equity preservation. Investors should expect that as long as this sentiment persists, the mortgage market will likely avoid the speculative excesses that once plagued the industry.
Conclusion
The Federal Reserve’s data for Q3 2025 confirms that the era of the "Home ATM" remains a relic of a past economic cycle. While the $108 billion increase in mortgage debt indicates a healthy and active market, the nature of that debt is demonstrably different from the bubble years. By prioritizing equity retention and tying debt growth to the development of new housing stock, the U.S. economy is currently navigating a path of stability. As we move into 2026, the absence of widespread equity withdrawal remains one of the strongest pillars supporting the resilience of the American housing market.