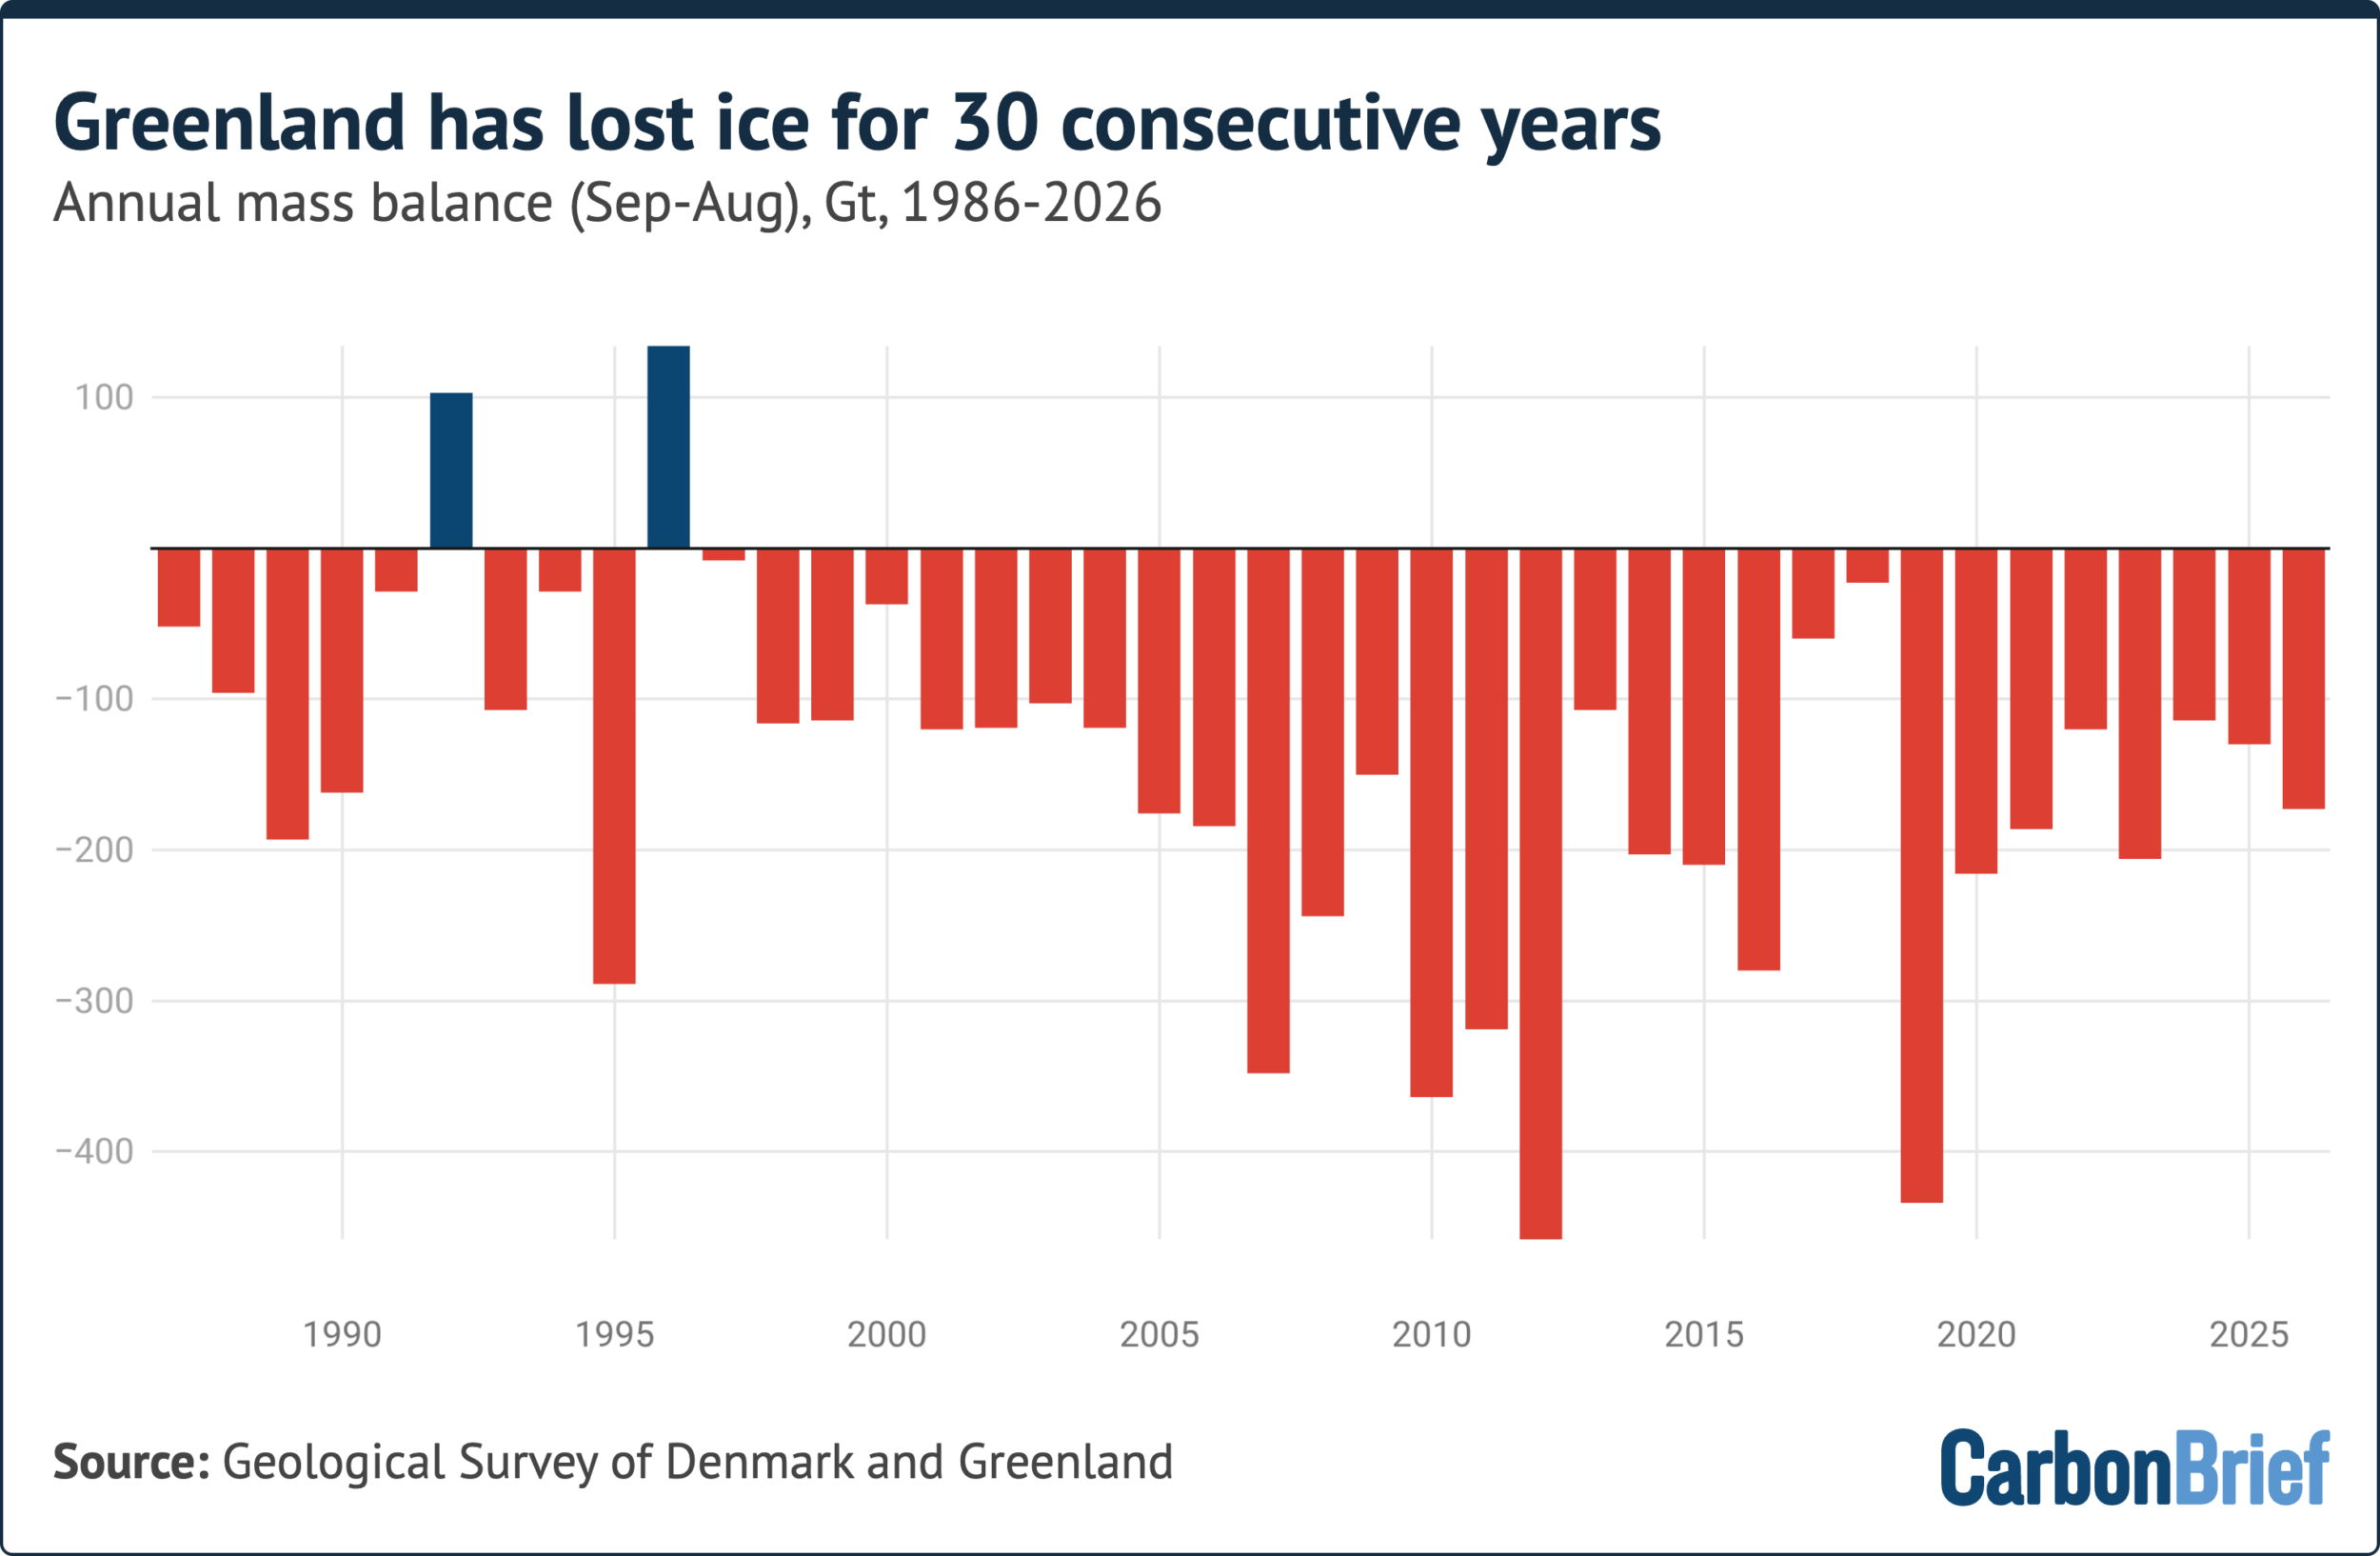
In a grim milestone for global climate science, Greenland has officially marked its 30th consecutive year of net ice loss. For three full decades, the world’s second-largest ice sheet has failed to replenish the mass it sheds, signaling a relentless, structural decline that persists regardless of annual weather fluctuations. Between September 2025 and August 2026, the region shed approximately 135 billion tonnes of ice, a figure that serves as a sobering reminder of the long-term impact of human-induced climate change.
The 30-Year Consensus: A Permanent Downward Trajectory
The significance of this 30-year streak cannot be overstated. In climatology, three decades is the standard benchmark used to distinguish between natural, erratic climate variability and the definitive "fingerprint" of long-term anthropogenic warming. By failing to record a single year of net growth since 1996, Greenland has transitioned from a stable glacial landscape to a primary driver of global sea-level rise.
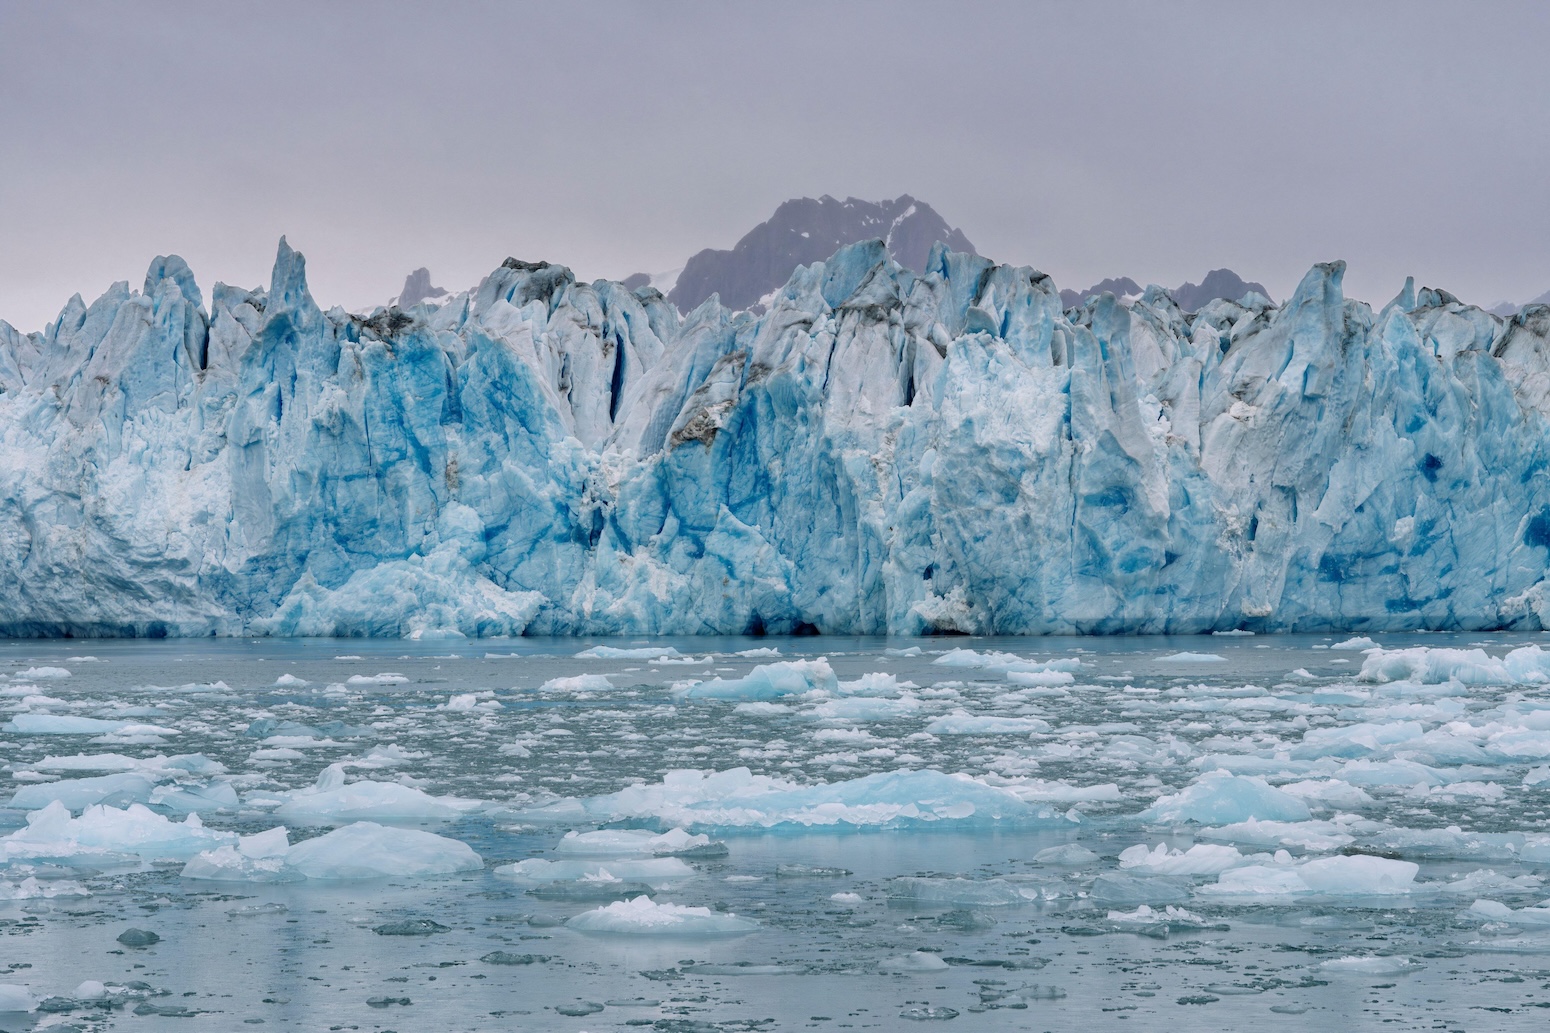
Even in years where atmospheric conditions are relatively "cool"—such as the 2025-26 cycle, which saw a delayed start to the summer melt season—the ice sheet remains firmly in the red. This confirms that the current state of the Greenland ice sheet is no longer governed by the whims of individual summer heatwaves, but by a fundamental, systemic imbalance.
Chronology of the 2025-2026 Ice Cycle
The annual cycle of the Greenland ice sheet typically spans from September 1st to August 31st. During the colder months of autumn, winter, and spring, the sheet gains mass through snowfall. As temperatures rise in June, the sheet shifts into a loss phase, where surface melting and iceberg calving outpace accumulation.
A Dry Start and a Cool Summer
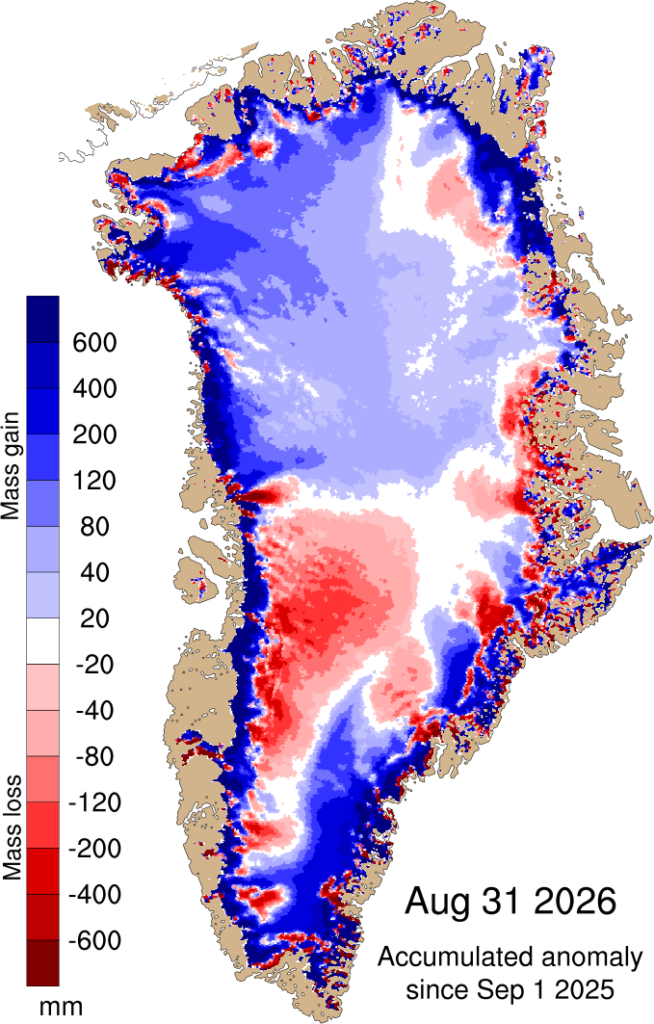
The 2025-26 cycle began with an unusually dry winter in southern Greenland, leaving the ice sheet with a deficit of roughly 40 billion tonnes of protective snow cover. In a typical year, this snow acts as a reflective shield, mitigating the intensity of summer melt.
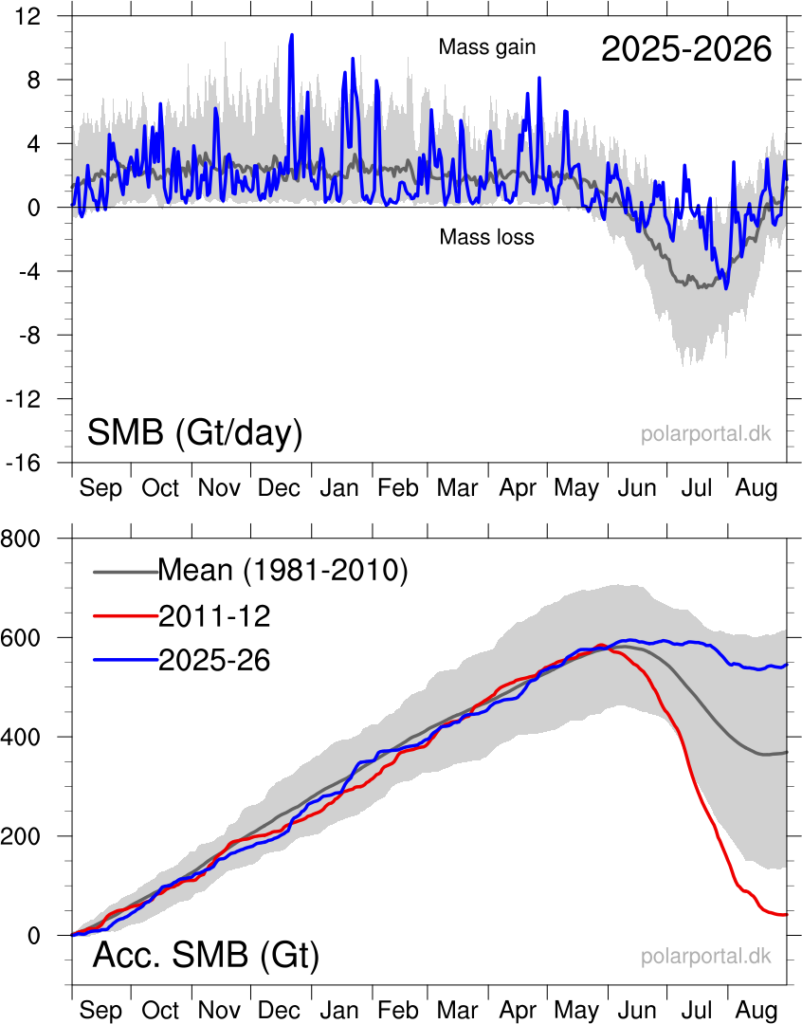
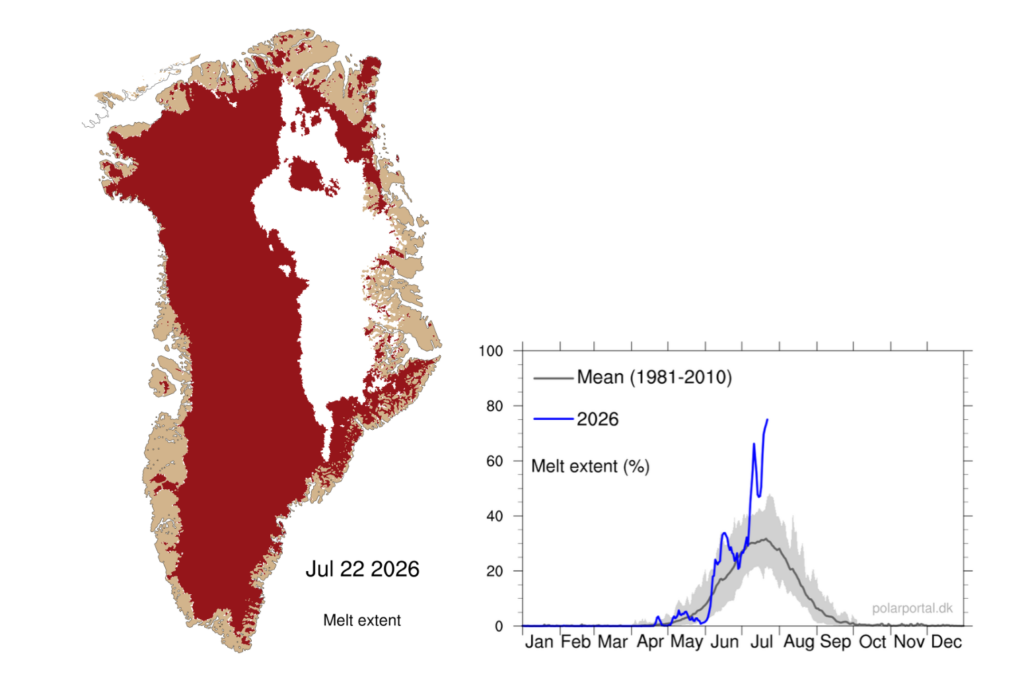
However, the 2026 summer provided a brief reprieve. Cool, cloudy conditions throughout June and early July prevented the intense solar radiation usually seen at the peak of the season. The melt season, defined as at least three consecutive days where more than 5% of the ice sheet experiences melting, did not begin until June 5th—nine days later than the 1981-2010 average.
The July Heat Spike
The reprieve was short-lived. By late June, weather patterns shifted, bringing warm, sunny conditions that lasted through July. At the peak of this period, on July 22, 2026, an estimated 74.9% of the ice sheet was undergoing surface melt. While this did not break the record set in July 2025 (where 81.2% of the ice sheet melted simultaneously), it underscored the vulnerability of the region to rapid, high-pressure weather systems.
The Petermann Calving Event
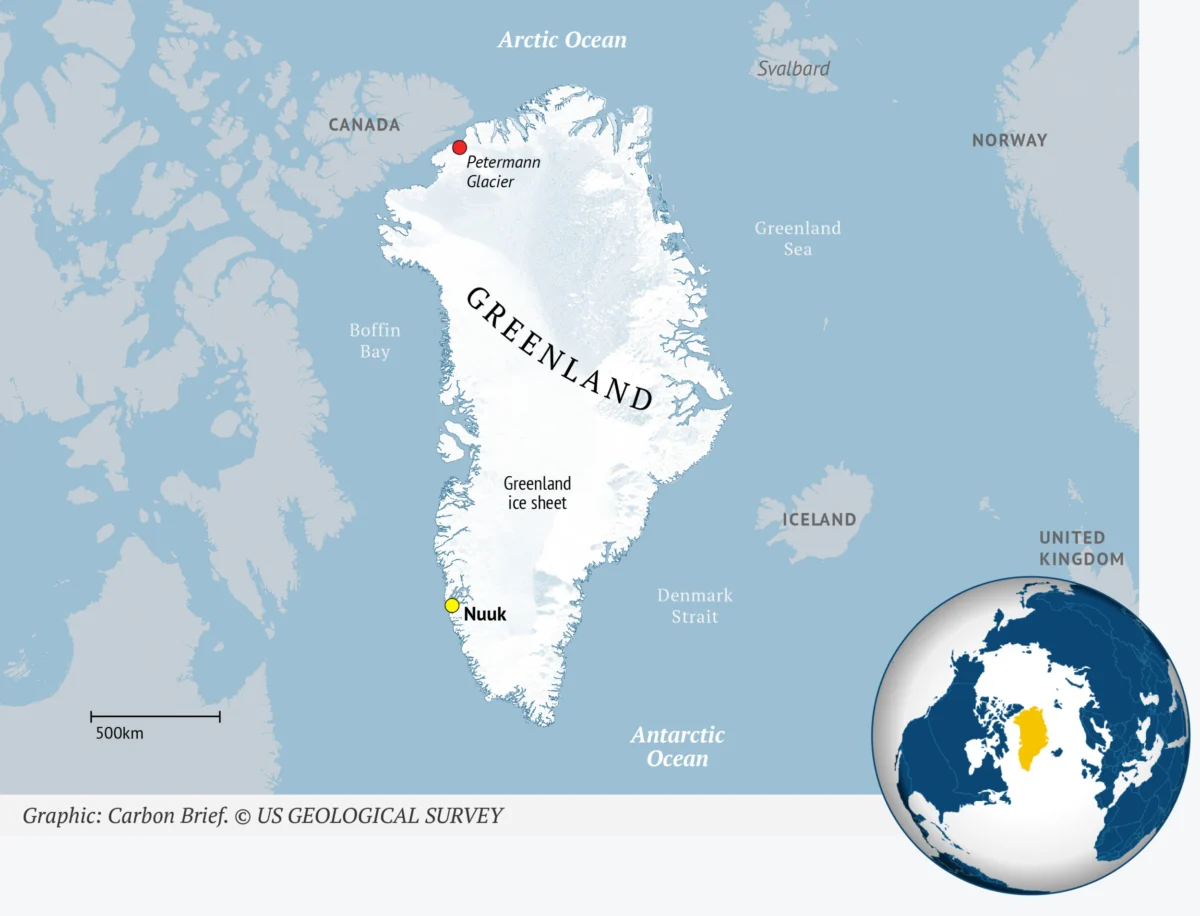
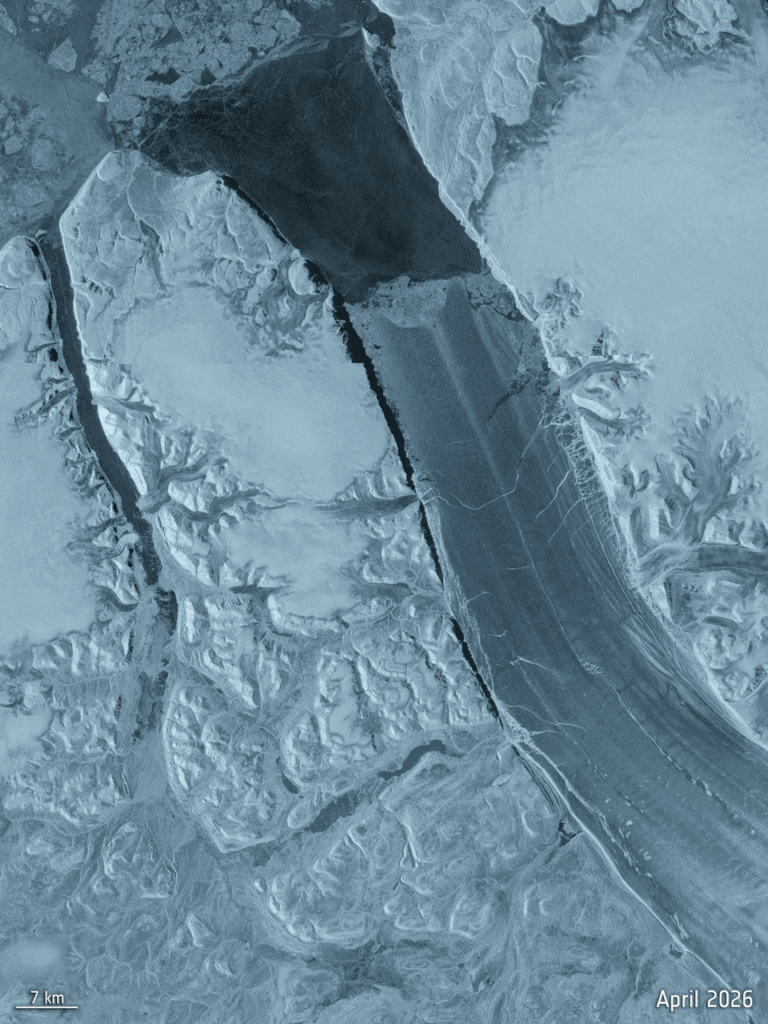
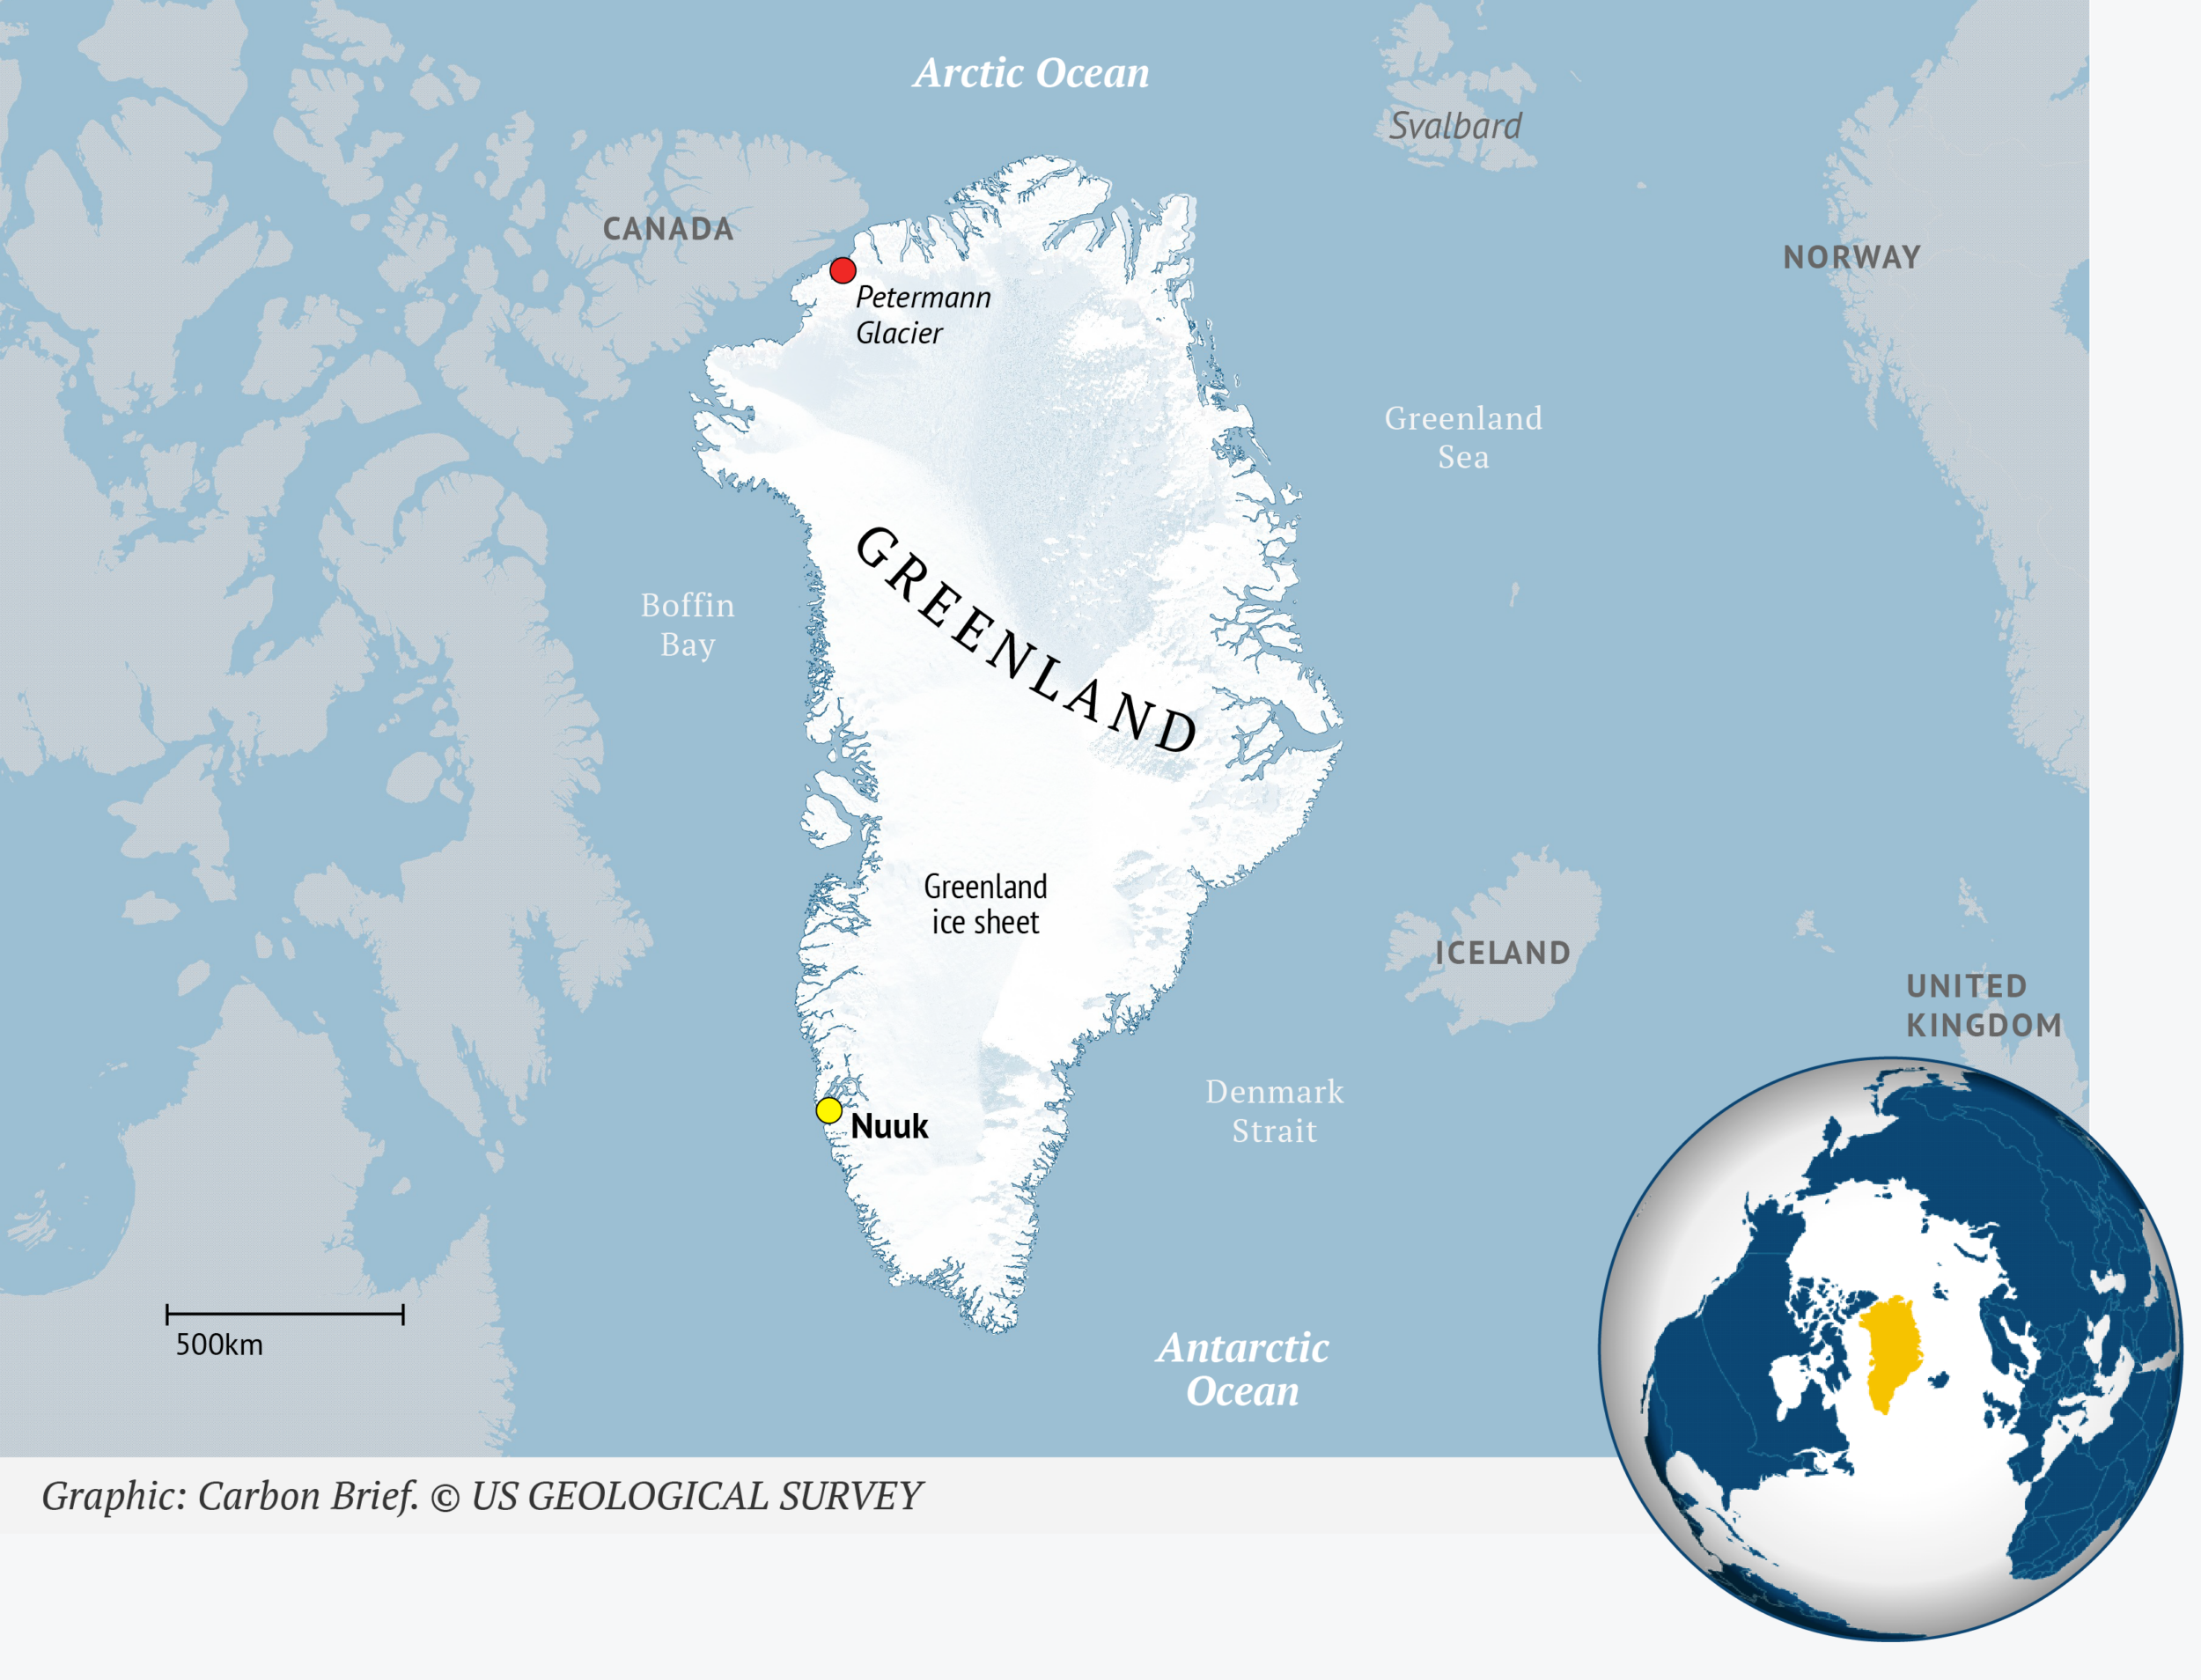
The most dramatic loss of the year occurred at the edges of the ice sheet. On August 4, 2026, a massive "ice island"—a tabular iceberg measuring 76 square kilometers—broke away from the floating tongue of the Petermann Glacier in northwest Greenland. With an estimated thickness of 150 meters, the volume of water frozen in this single iceberg is sufficient to submerge the entirety of Greater London to a depth of 6.65 meters. This event was the largest calving of an Arctic glacier since 2020 and serves as a harbinger of further instability in the region.
Supporting Data: Dissecting the Mass Balance
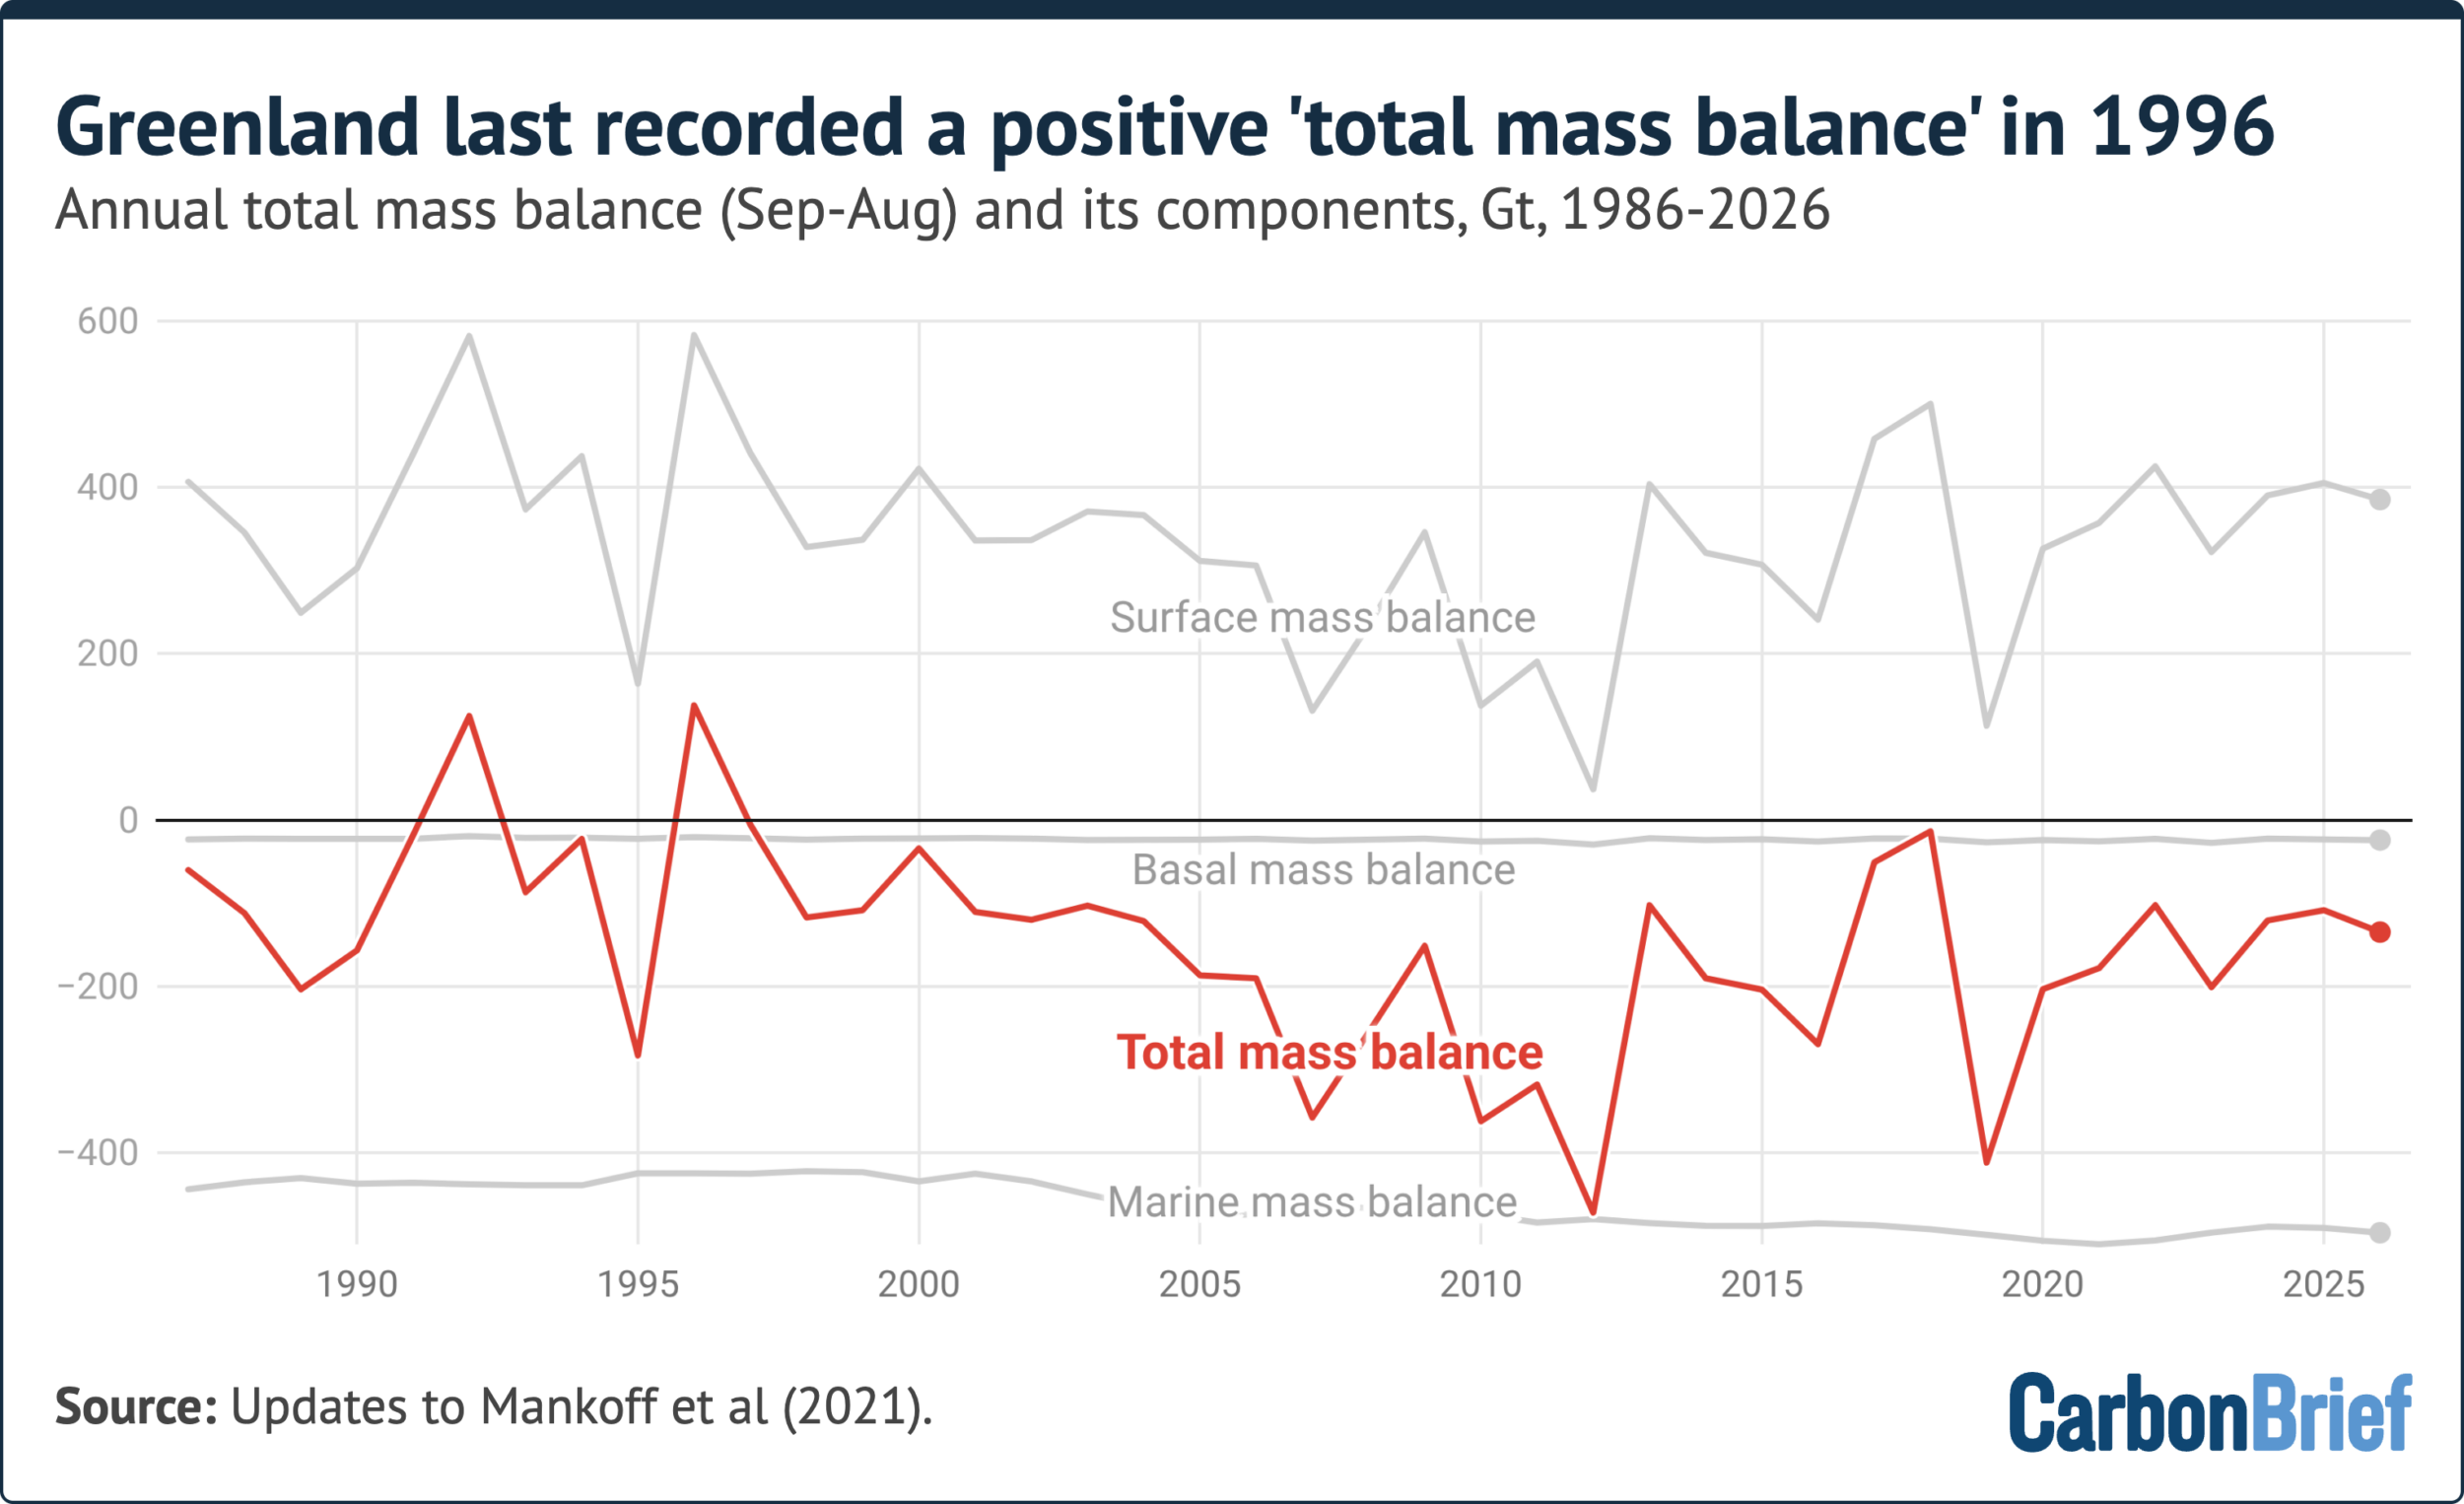
Scientists track the health of the ice sheet through two primary metrics: Surface Mass Balance (SMB) and Total Mass Balance.
- Surface Mass Balance: This measures the difference between snowfall accumulation and surface melt. In 2025-26, the SMB was 519 billion tonnes. While this was the sixth-highest in a 46-year dataset, it remains an incomplete picture of the ice sheet’s health.
- Total Mass Balance: This is the "gold standard" for determining if the ice sheet is growing or shrinking. It accounts for SMB, iceberg calving, and basal melting (melting at the underside of the ice sheet). Once these factors are combined, the total mass balance for 2025-26 confirms a loss of 135 billion tonnes. Some advanced models, utilizing satellite gravimetry and GPS data, estimate the loss as high as 173 billion tonnes.
The discrepancy between these numbers highlights the inherent challenges in modeling a massive, shifting geological entity. However, all models converge on the same conclusion: the net loss is accelerating. While annual losses in the 1980s averaged around 60 billion tonnes, that figure surged to 264 billion tonnes during the 2010s.
The "Omega" Pattern: Global Weather Interplay
The relatively "moderate" outcome of the 2025-26 season was largely a byproduct of global atmospheric dynamics, specifically the jet stream. Throughout the summer of 2026, the northern hemisphere experienced an "Omega block"—a stationary, high-pressure system shaped like the Greek letter Ω.
This pattern produced record-breaking heatwaves in Europe and North America while simultaneously directing cooler, moist air toward Greenland. Had the jet stream shifted by even a few hundred kilometers, Greenland would have experienced a catastrophic melt year. This emphasizes that the ice sheet’s survival is currently being "protected" by the random positioning of global weather patterns, rather than by any inherent stabilization of the Arctic climate.
Implications: The "Greenlandification" of Antarctica
The findings from Greenland are no longer isolated observations; they are becoming a blueprint for the future of the world’s largest ice sheet: Antarctica. A new assessment published in Scientific Data reveals that Greenland and Antarctica have together lost 11,309 billion tonnes of ice since 1979, contributing to approximately 32mm of global sea-level rise.
Greenland currently dominates this contribution, accounting for roughly two-thirds of the total loss. However, the processes observed in Greenland—the loss of ice shelves, increased surface melt, and the seasonal retreat of outlet glaciers—are now being observed in West Antarctica. Scientists refer to this as the "Greenlandification of Antarctica."
While Greenland’s contribution to sea-level rise has been measurable in centimeters, Antarctica contains enough ice to raise sea levels by meters. As the planet warms, the instability that has characterized Greenland for 30 years is moving south, threatening to accelerate global sea-level rise at a pace that could outstrip current projections.
Conclusion: A Turning Point for Climate Policy
The 30th year of consecutive ice loss is a testament to the persistent nature of global warming. It is a clear signal that the damage to the polar cryosphere is deep-seated and ongoing.
As international researchers and policymakers grapple with these findings, the focus must shift from viewing these events as isolated "natural disasters" to recognizing them as expected outcomes of a warming atmosphere. The data is no longer a warning of what might happen; it is a record of what is currently occurring. Without significant and rapid reductions in global greenhouse gas emissions, the 31st, 32nd, and subsequent years of loss are all but guaranteed, further committing the planet to a future of rising tides and an irrevocably changed Arctic.