In the high-stakes world of digital marketing, the term "conversion rate" is often treated as a singular, golden metric. Marketers frequently ask, "What is a good conversion rate?" hoping for a universal number—a magic percentage that signifies success. However, as the 2024 Conversion Benchmark Report by Unbounce reveals, the truth is far more nuanced. Relying on a one-size-fits-all metric is not just inaccurate; it is a strategic error that can lead to misaligned goals and wasted marketing spend.
Based on an exhaustive analysis of over 57 million conversions, 41,000 landing pages, and 464 million pageviews, the data makes one thing clear: context is the only variable that truly matters.

The Baseline: What is a Median Conversion Rate?
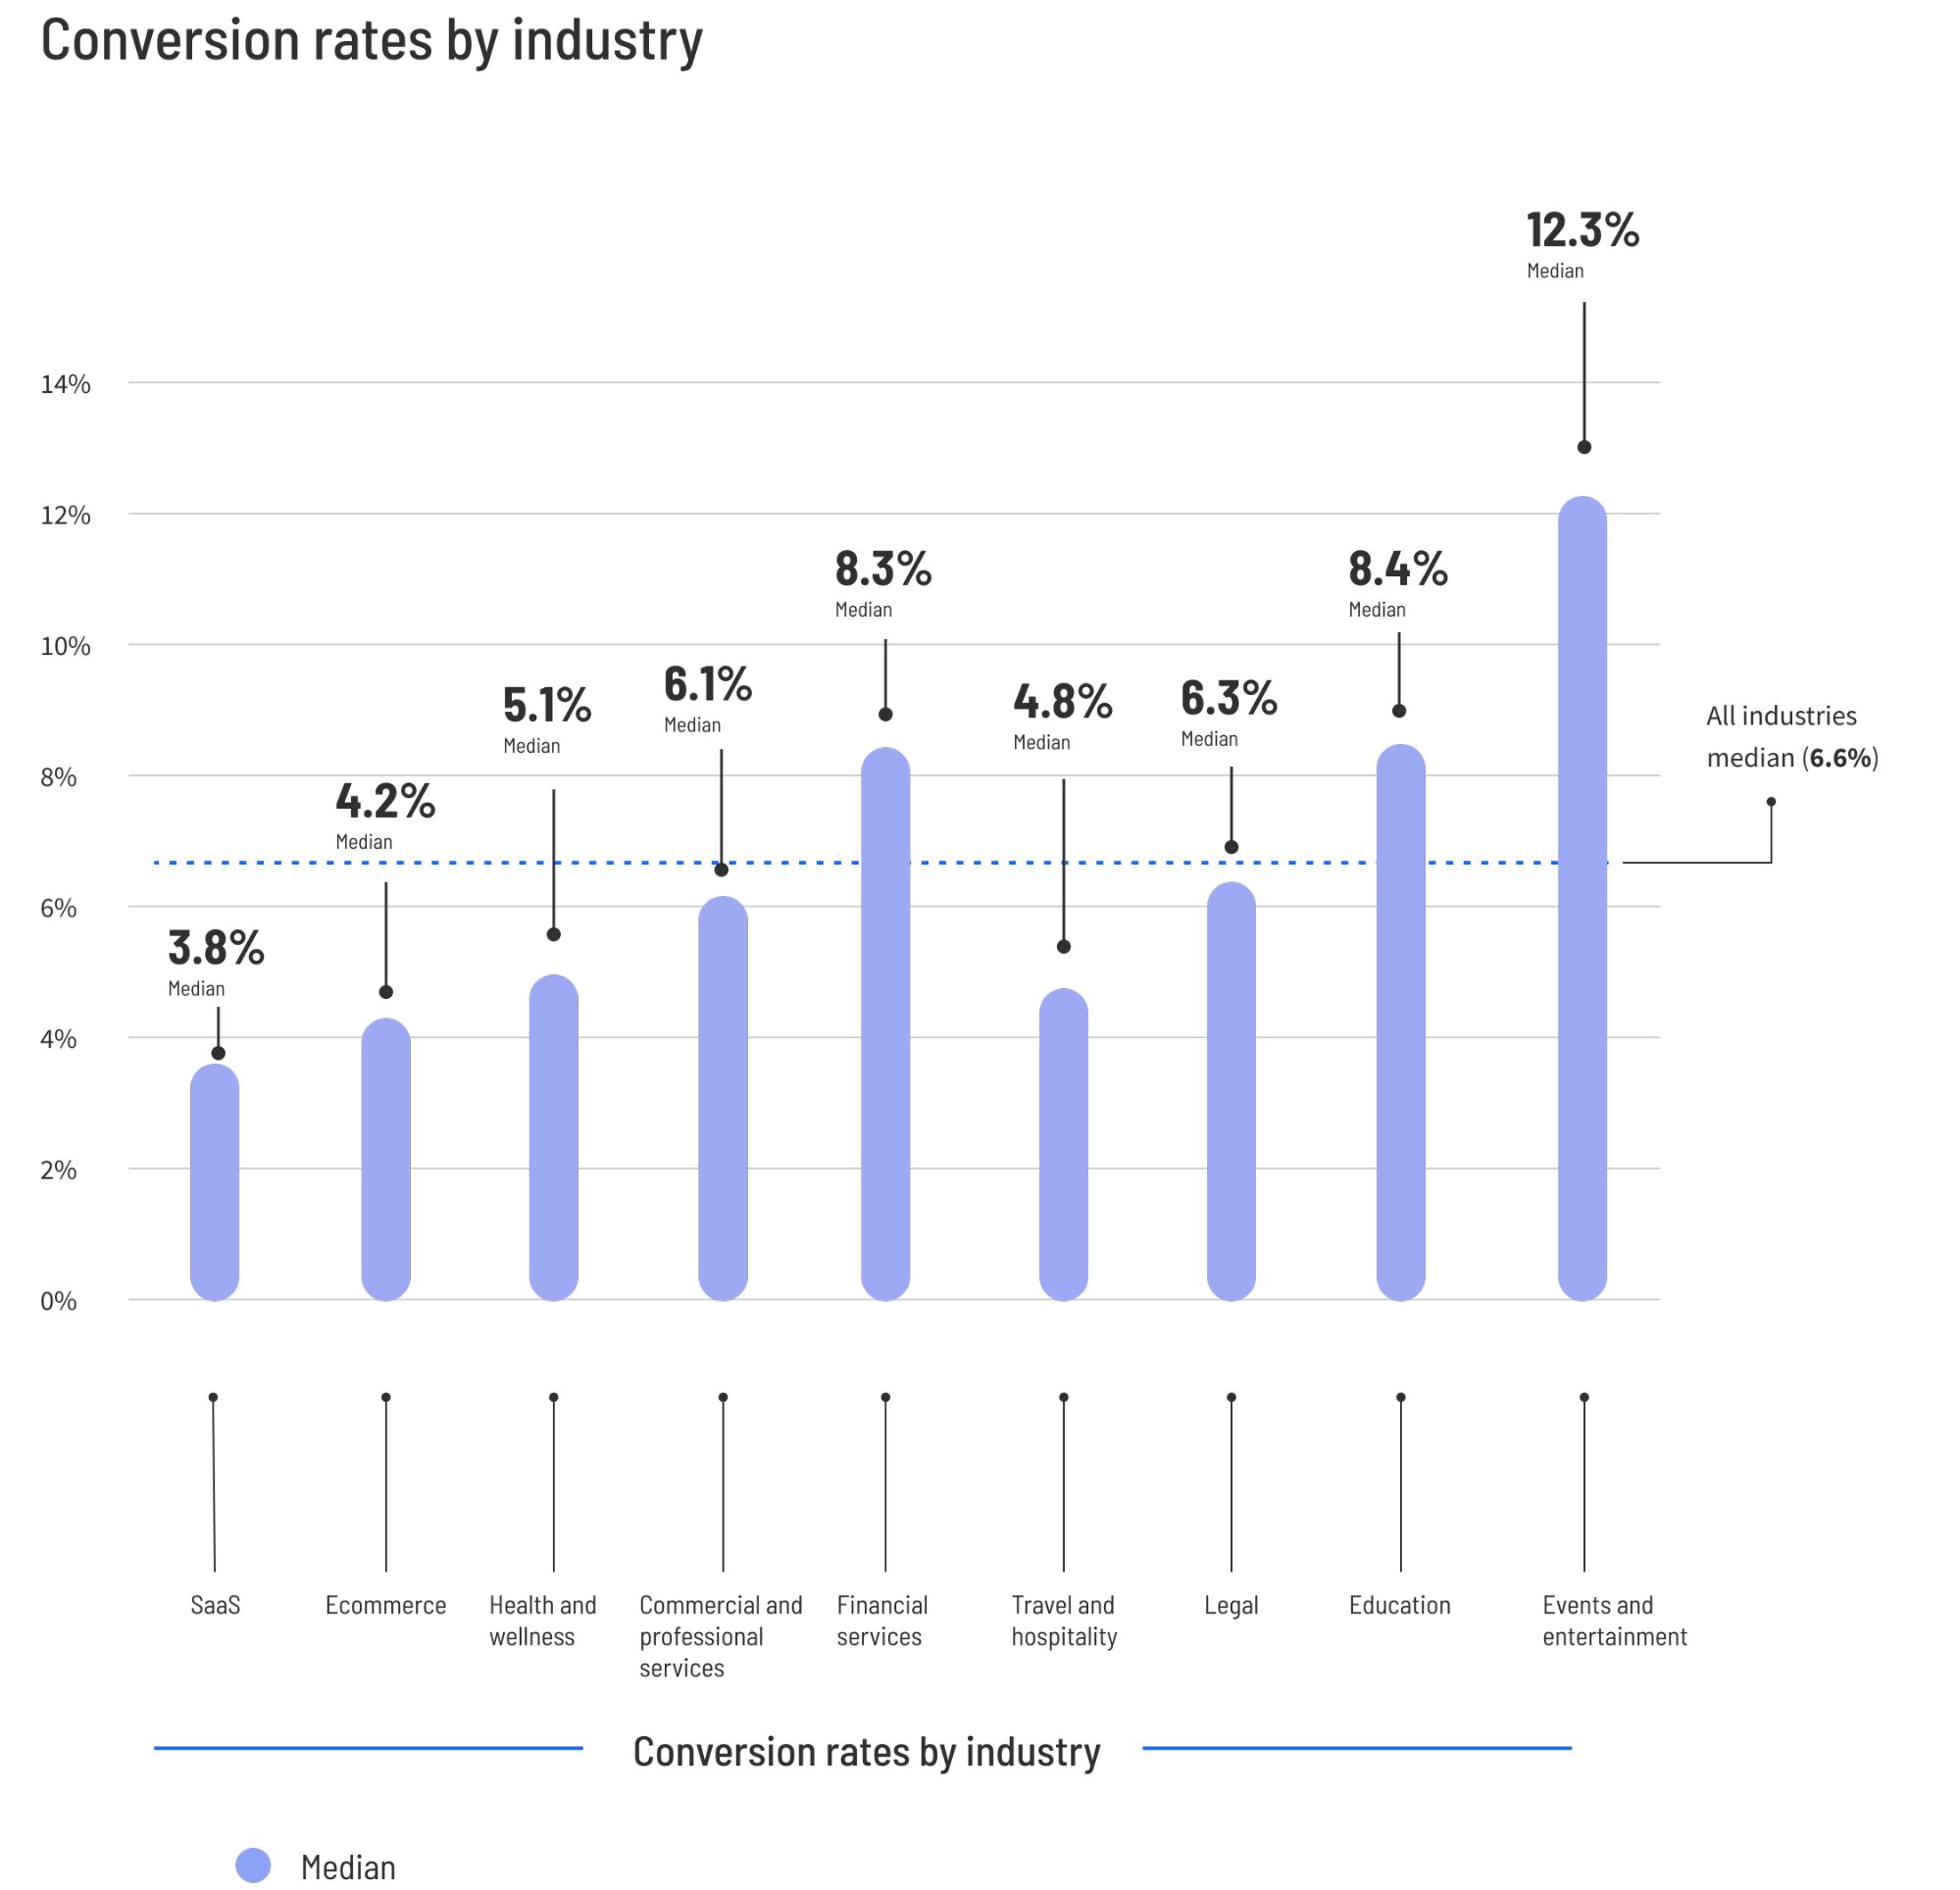
Across all industries, the median conversion rate for landing pages sits at 6.6%. While this provides a basic point of reference, it is merely a middle-of-the-pack indicator. Much like the average height of a human, this number provides a general sense of the landscape but offers zero actionable intelligence regarding your specific performance.
The distinction between "average" and "median" is critical here. The report utilizes median values to avoid the skewing effects of "unicorn" pages—those rare instances where a campaign hits a 90% conversion rate—or pages that suffer from technical issues and see near-zero engagement. By focusing on the median, marketers gain a realistic view of what the "typical" page achieves, allowing for a more honest self-assessment.

Understanding the "Good" Benchmark: The 75th Percentile
If 6.6% is the median, what defines excellence? The report identifies the "good" threshold as the 75th percentile—the point at which a page begins to outperform 75% of its industry competitors. Depending on your niche, this "good" performance starts at 11.4% and can soar as high as 40.8%.
Achieving these top-tier numbers is not about luck; it is about recognizing the unique user intent, campaign structure, and audience expectations inherent to your industry.
Industry Deep-Dive: A Tale of Varied Expectations
To understand how your performance compares, you must look at your specific sector. The variance between industries is profound, driven by the nature of the transaction and the urgency of the consumer.
Ecommerce: The Volume Game
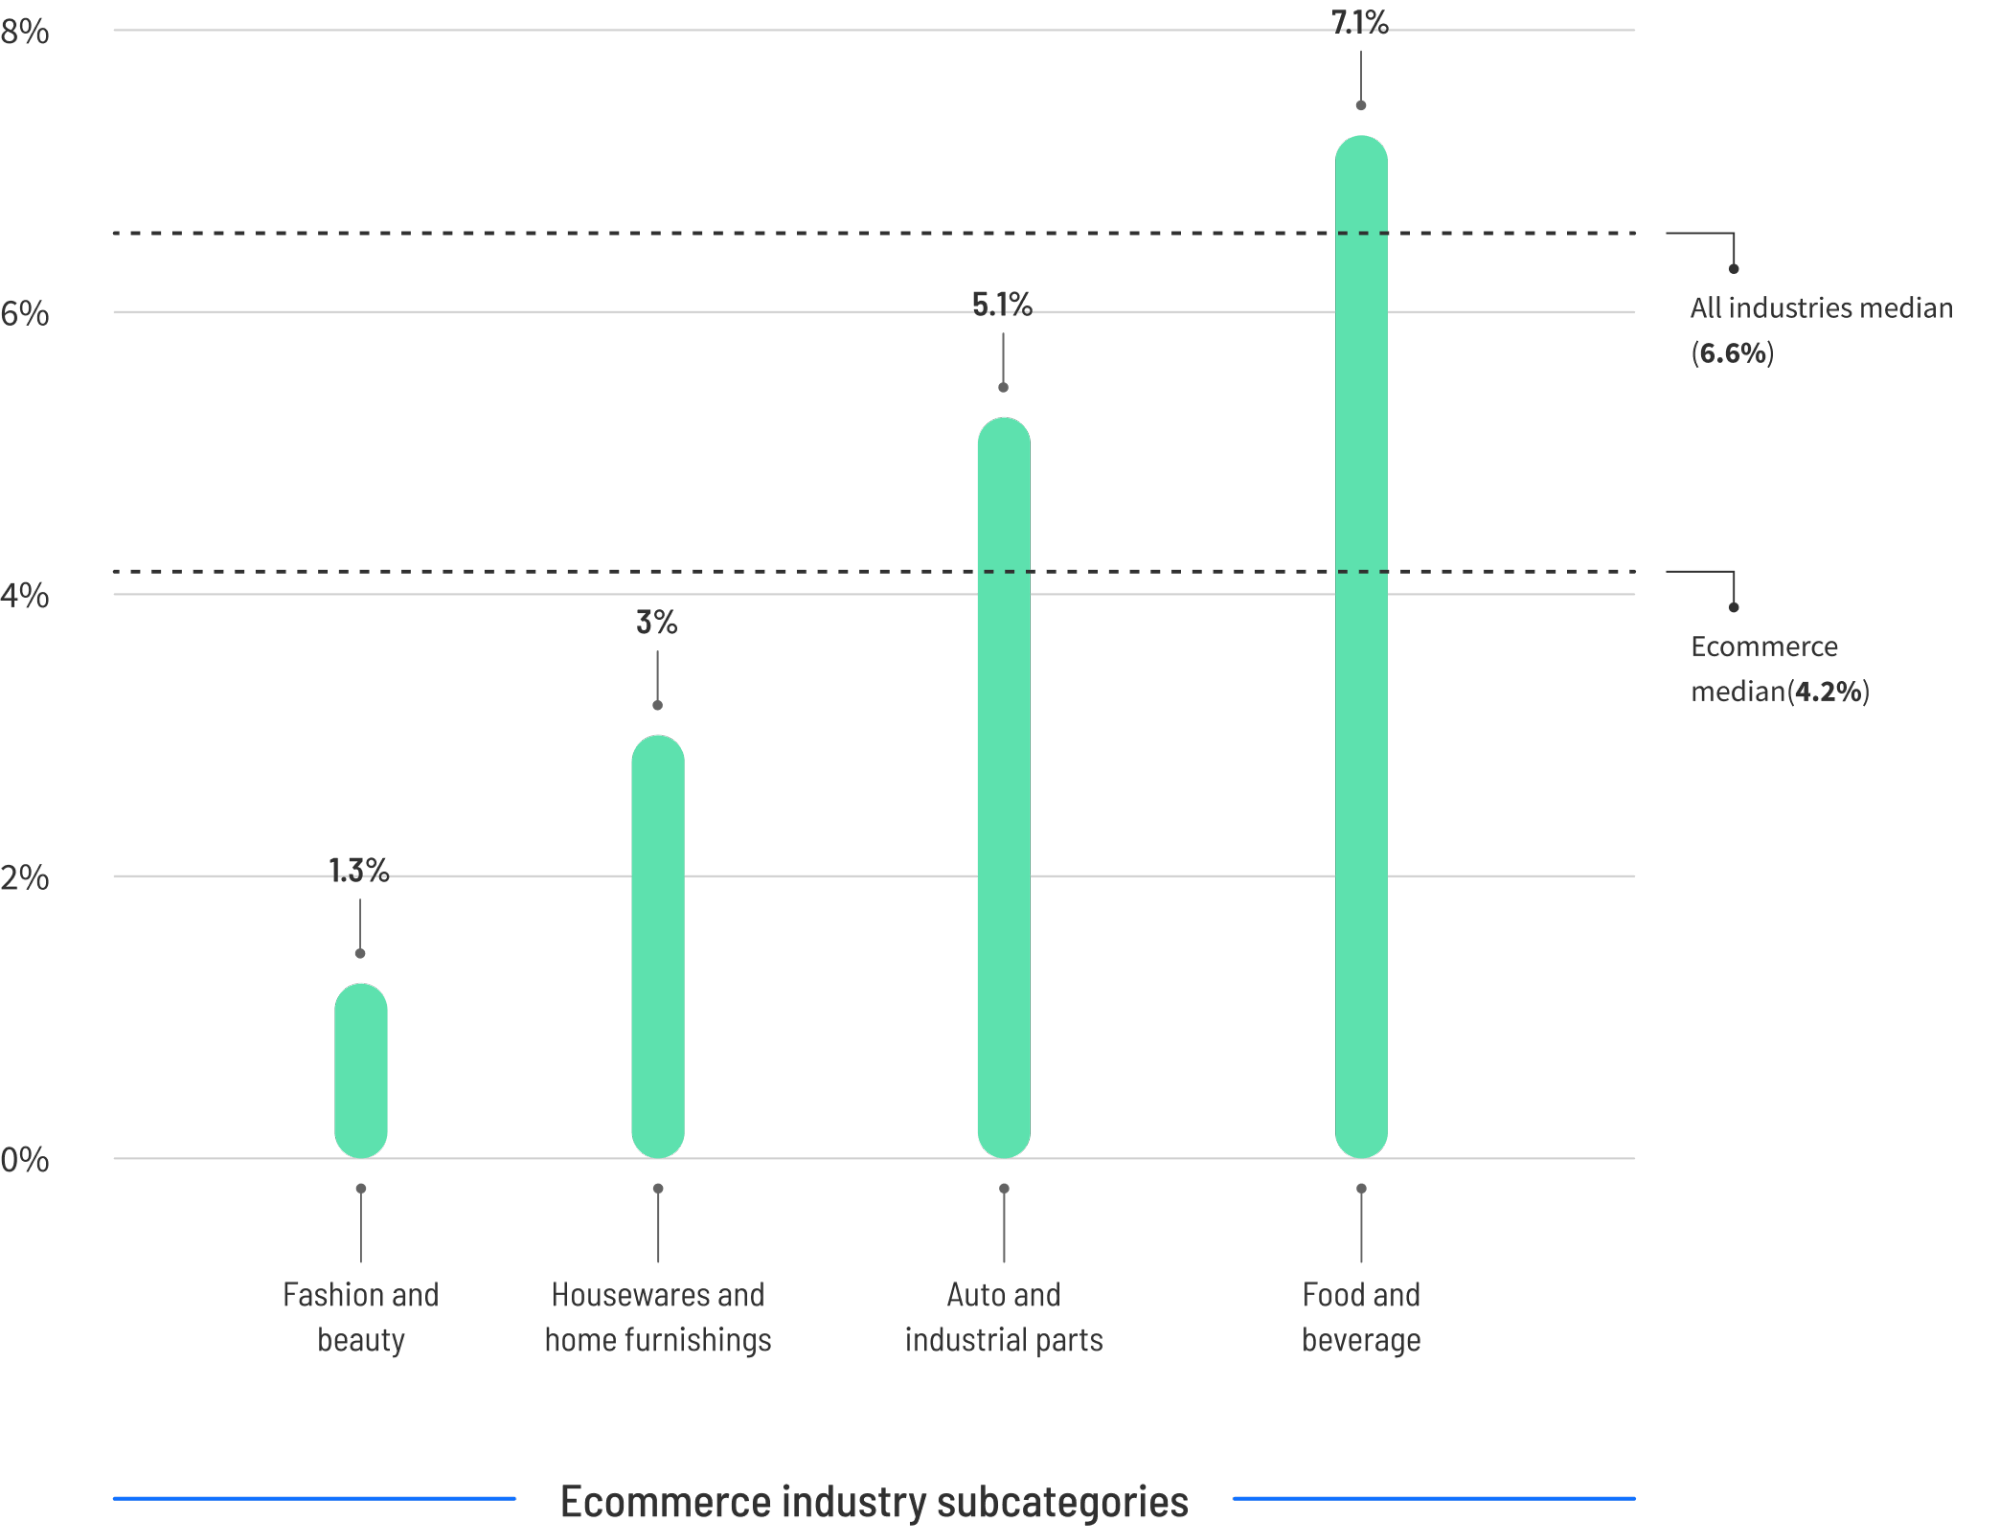
The median conversion rate for ecommerce is 4.2%. However, the top 25% of performers see rates of 11.4% or higher. This jump represents a massive revenue opportunity. For a site with 10,000 monthly visitors, moving from the median to the top quartile could result in an additional 720 conversions, potentially translating into tens of thousands of dollars in incremental monthly revenue.
SaaS: Navigating Complexity
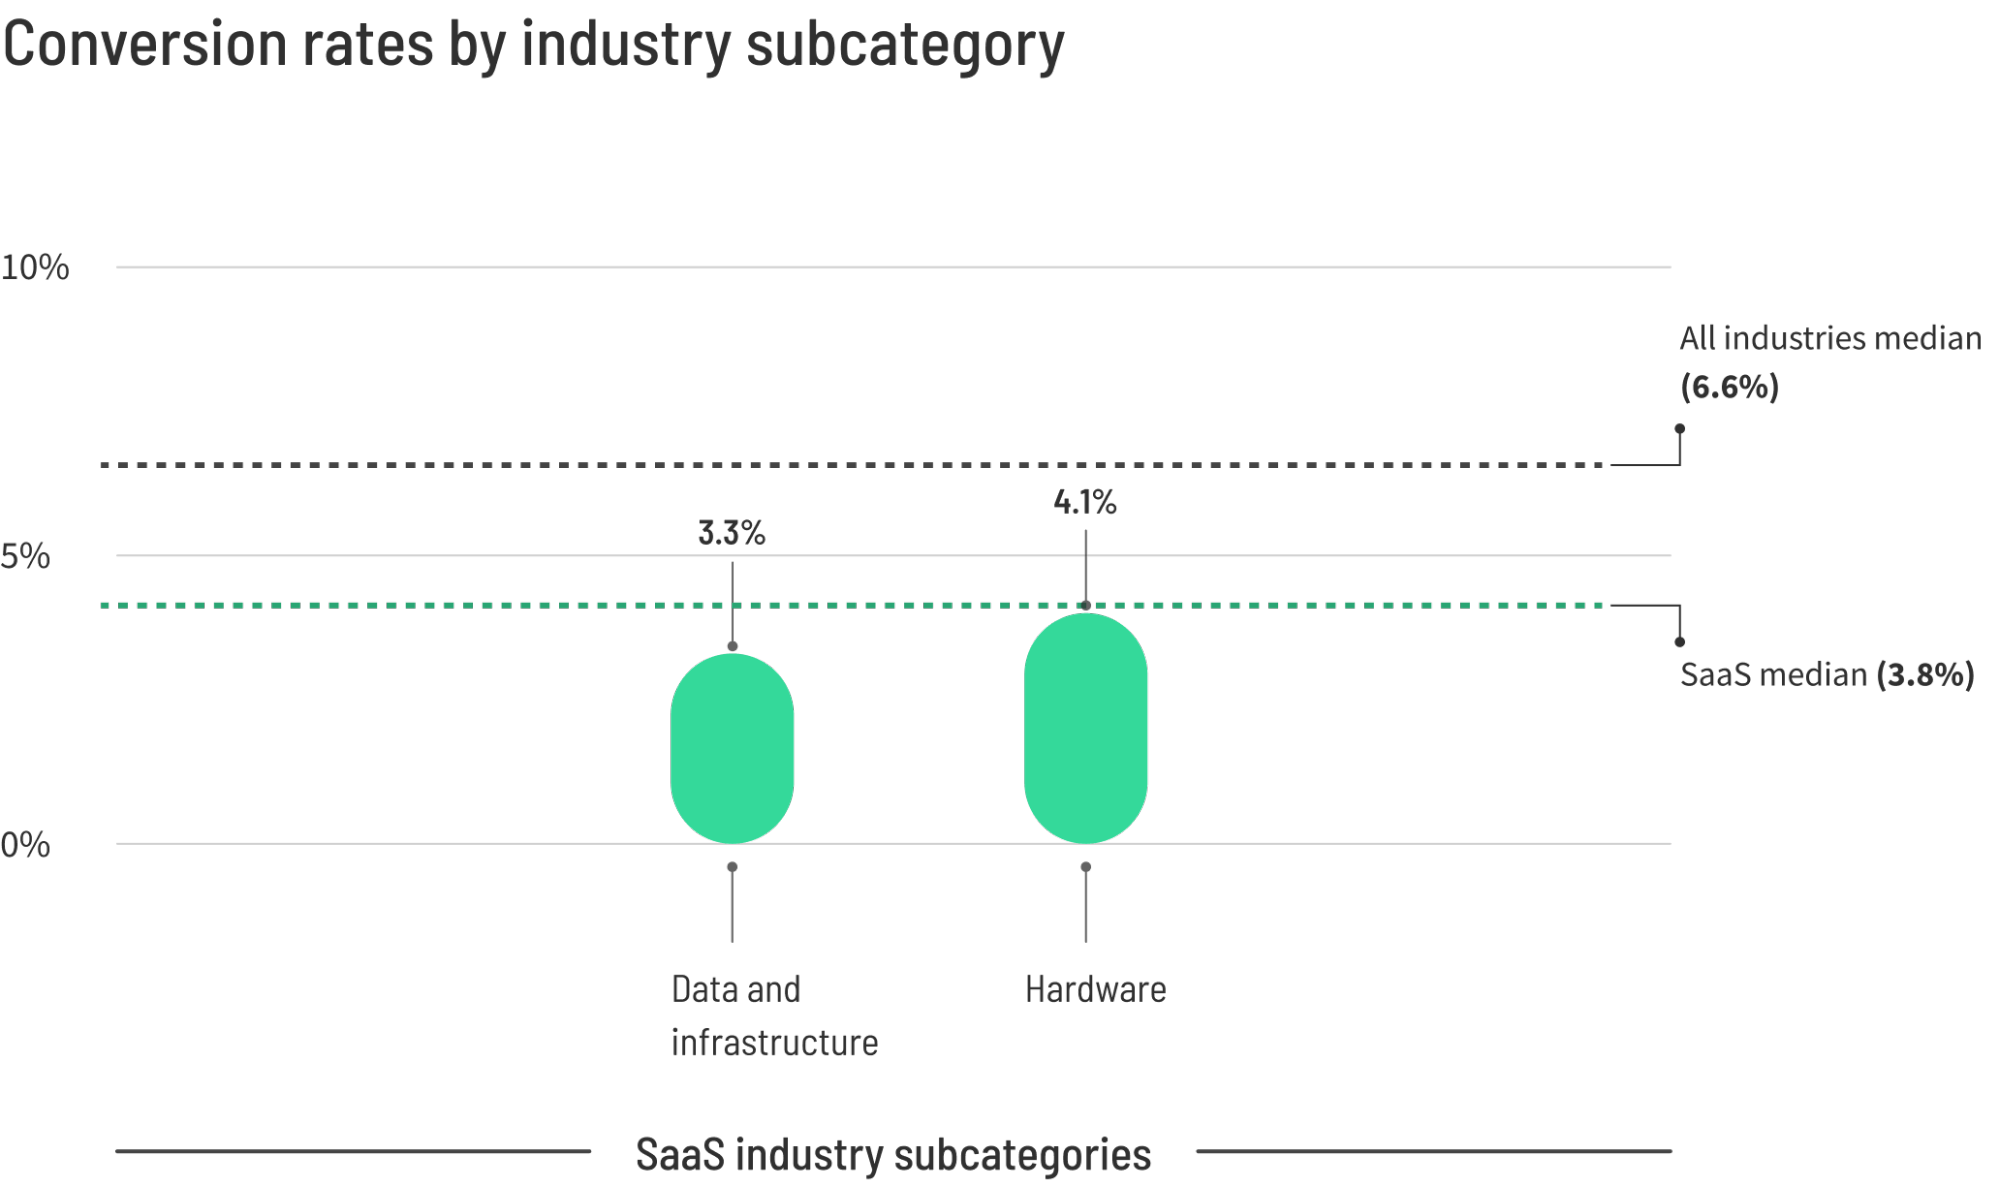
SaaS landing pages face a more difficult climb, with a median conversion rate of 3.8%. This lower figure is a byproduct of complex product offerings and longer sales cycles. Potential users are often in the "research" phase rather than the "buy" phase. To join the top 25% (11.6% or higher), SaaS companies must excel at reducing perceived risk—often through free trials or ironclad money-back guarantees.
Professional Services: The Trust Factor
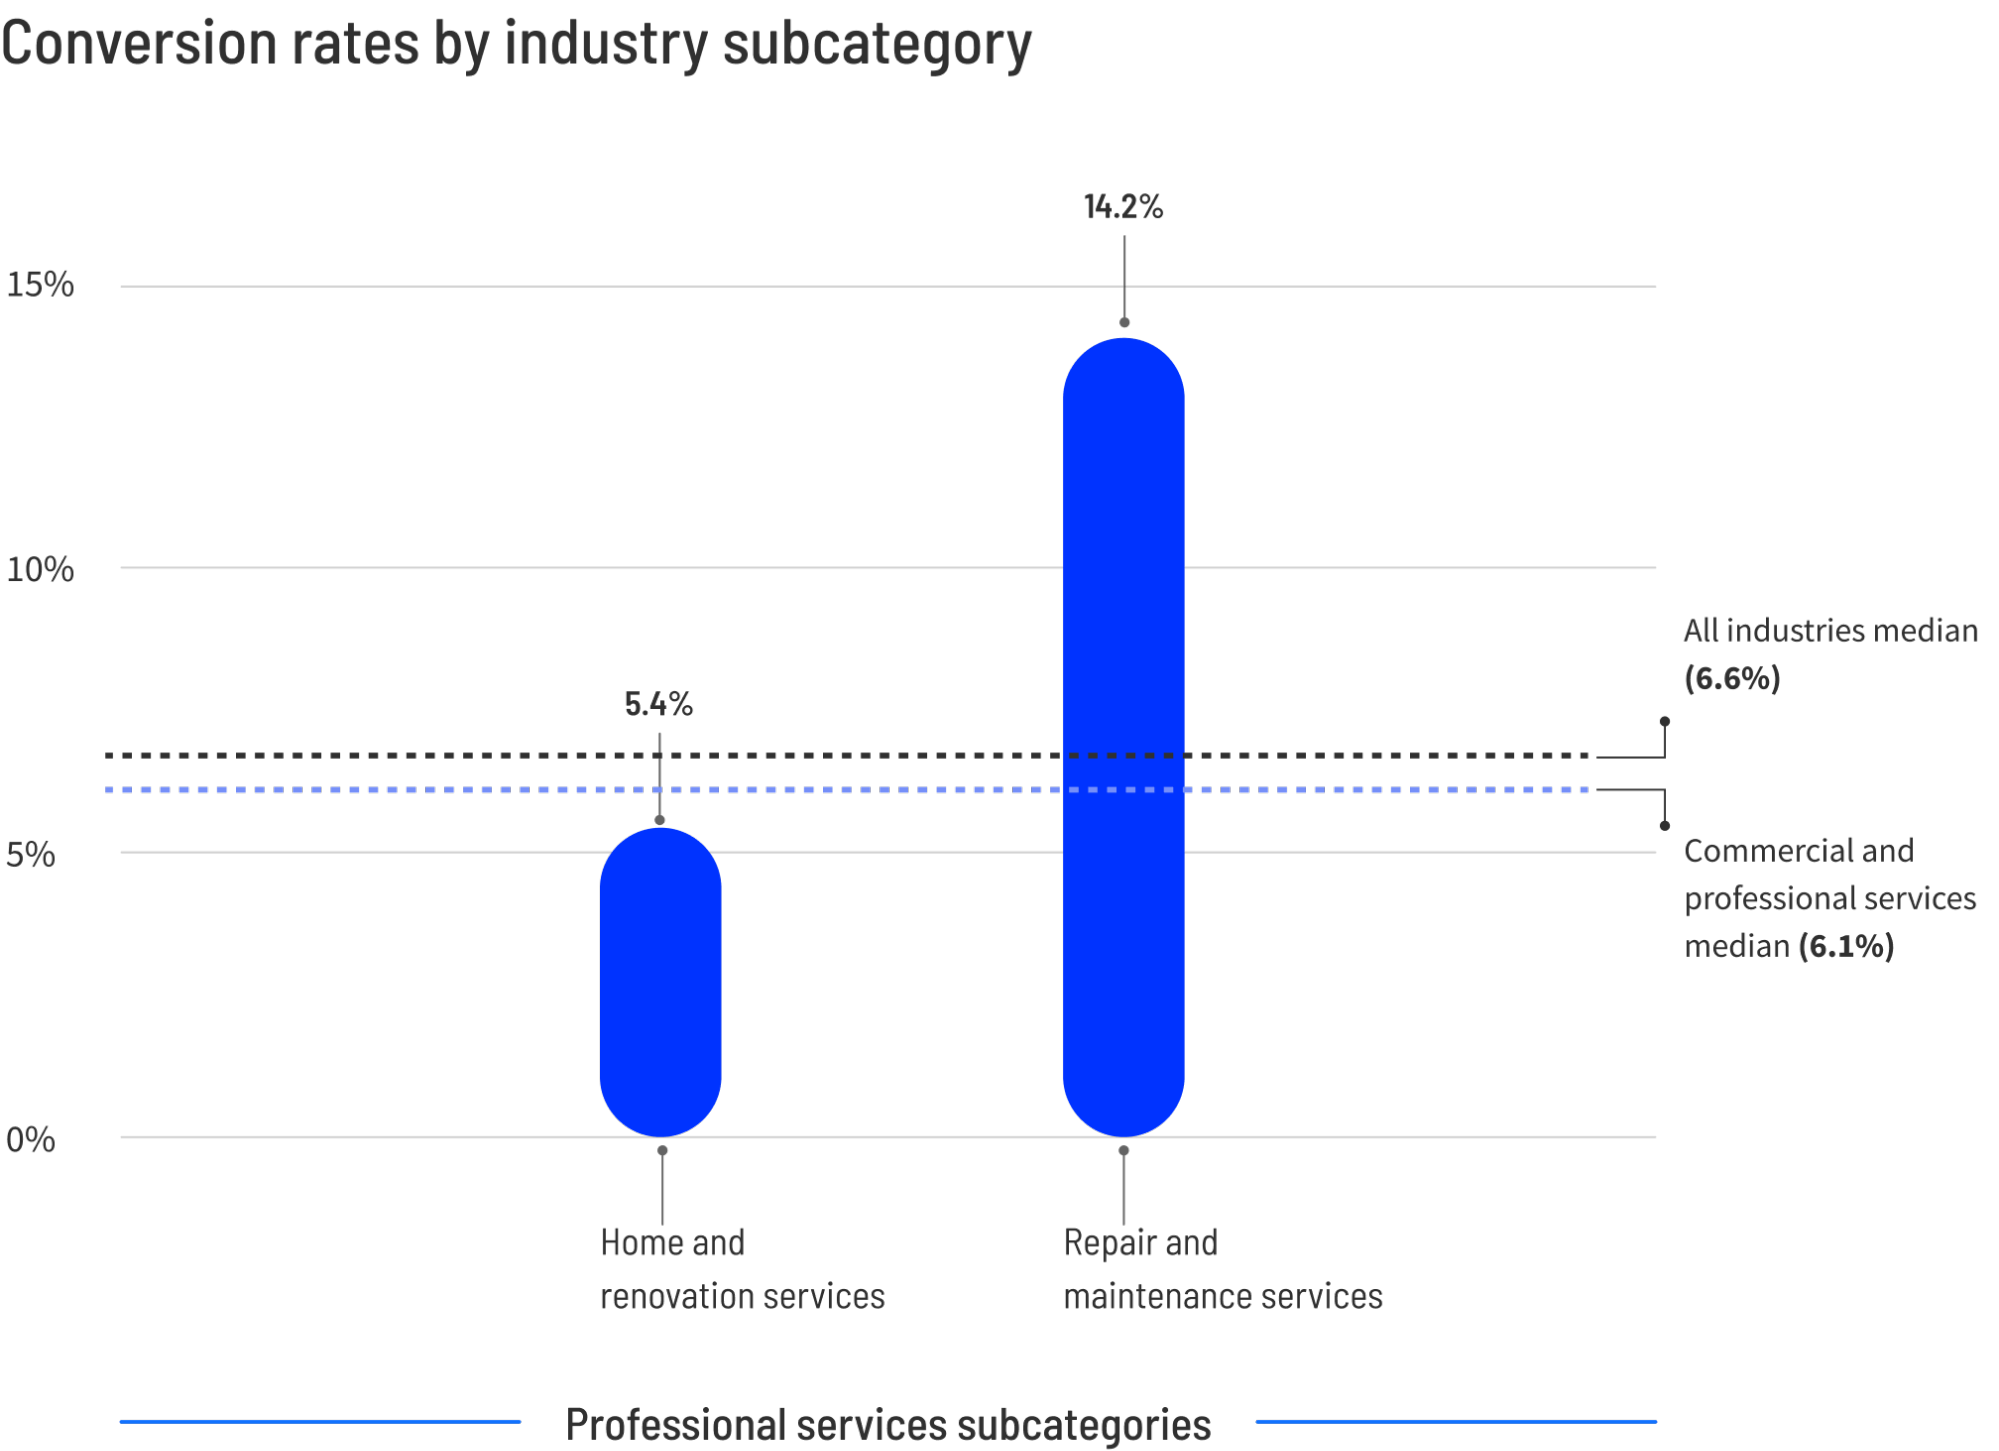
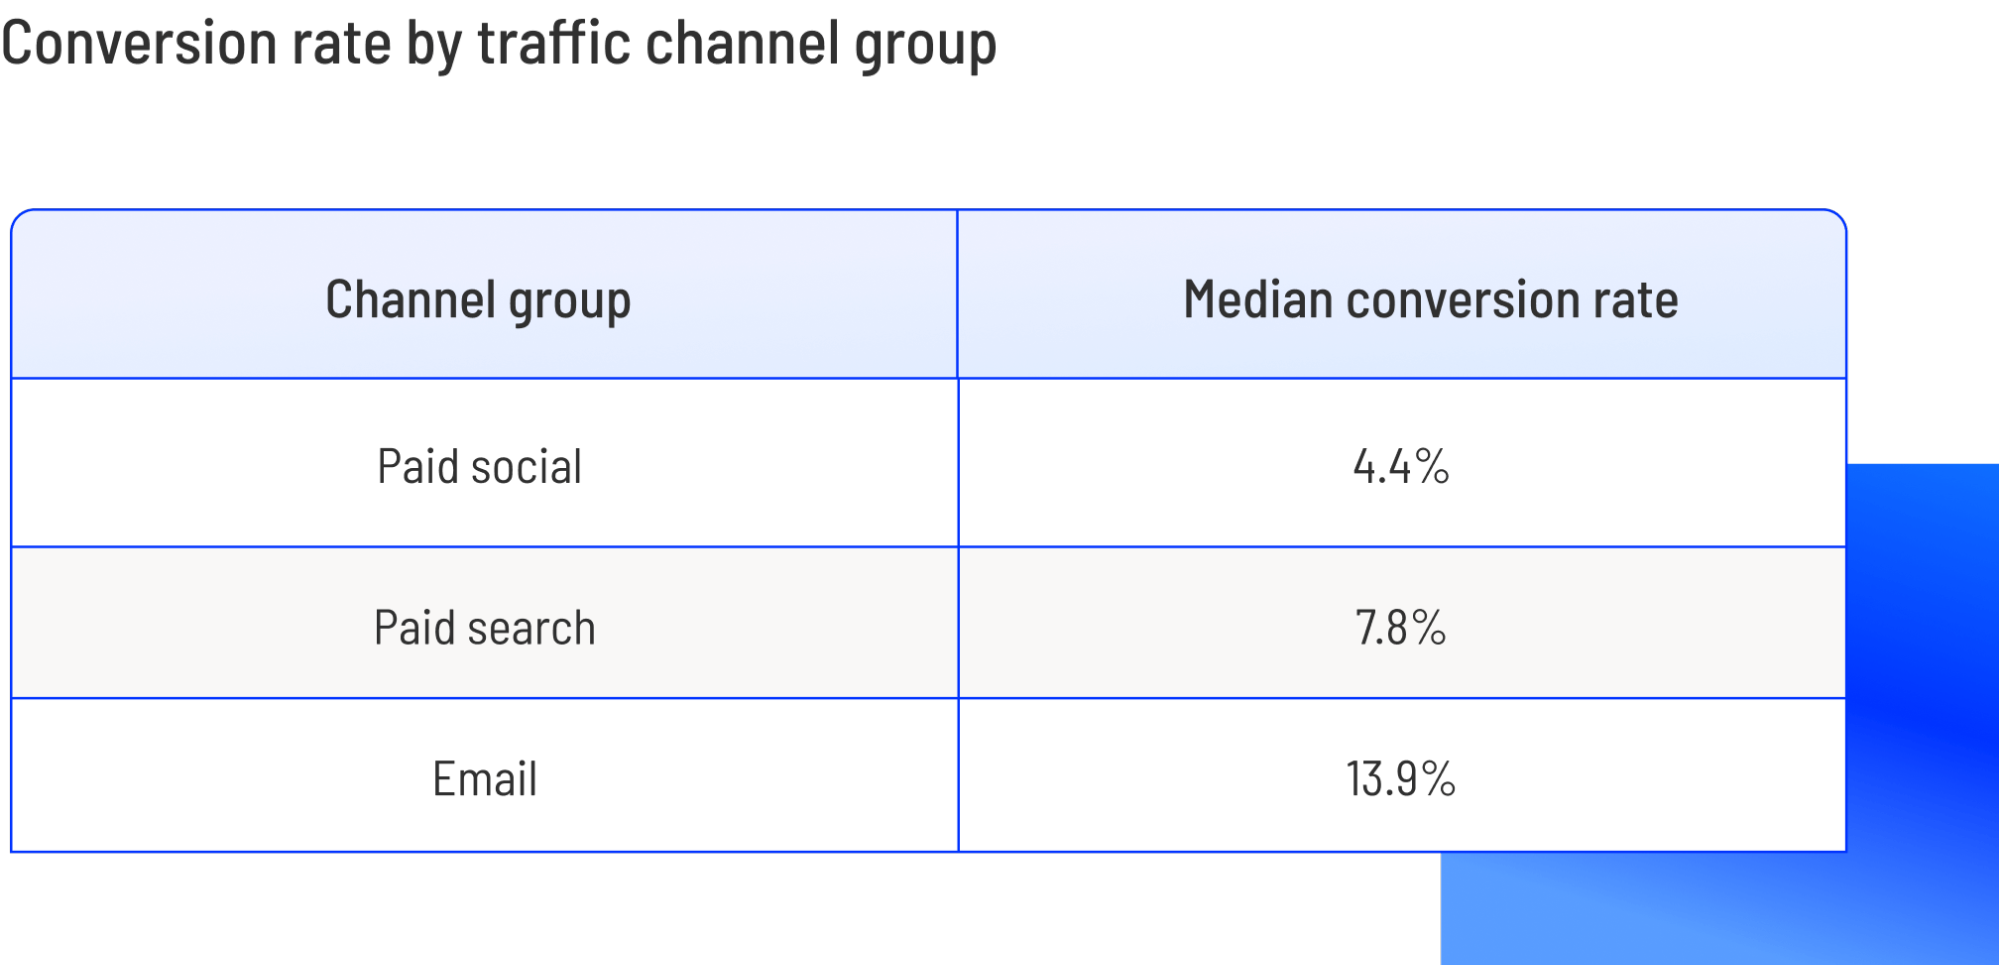
Professional services, ranging from legal firms to consultants, see a median of 6.1%. To enter the top quartile, one must hit 14.1%. Interestingly, this industry highlights the importance of traffic sources; email marketing consistently outperforms paid social, proving that nurturing existing leads is often more profitable than casting a wide net with paid advertising.
Financial Services: The High-Intent Sector
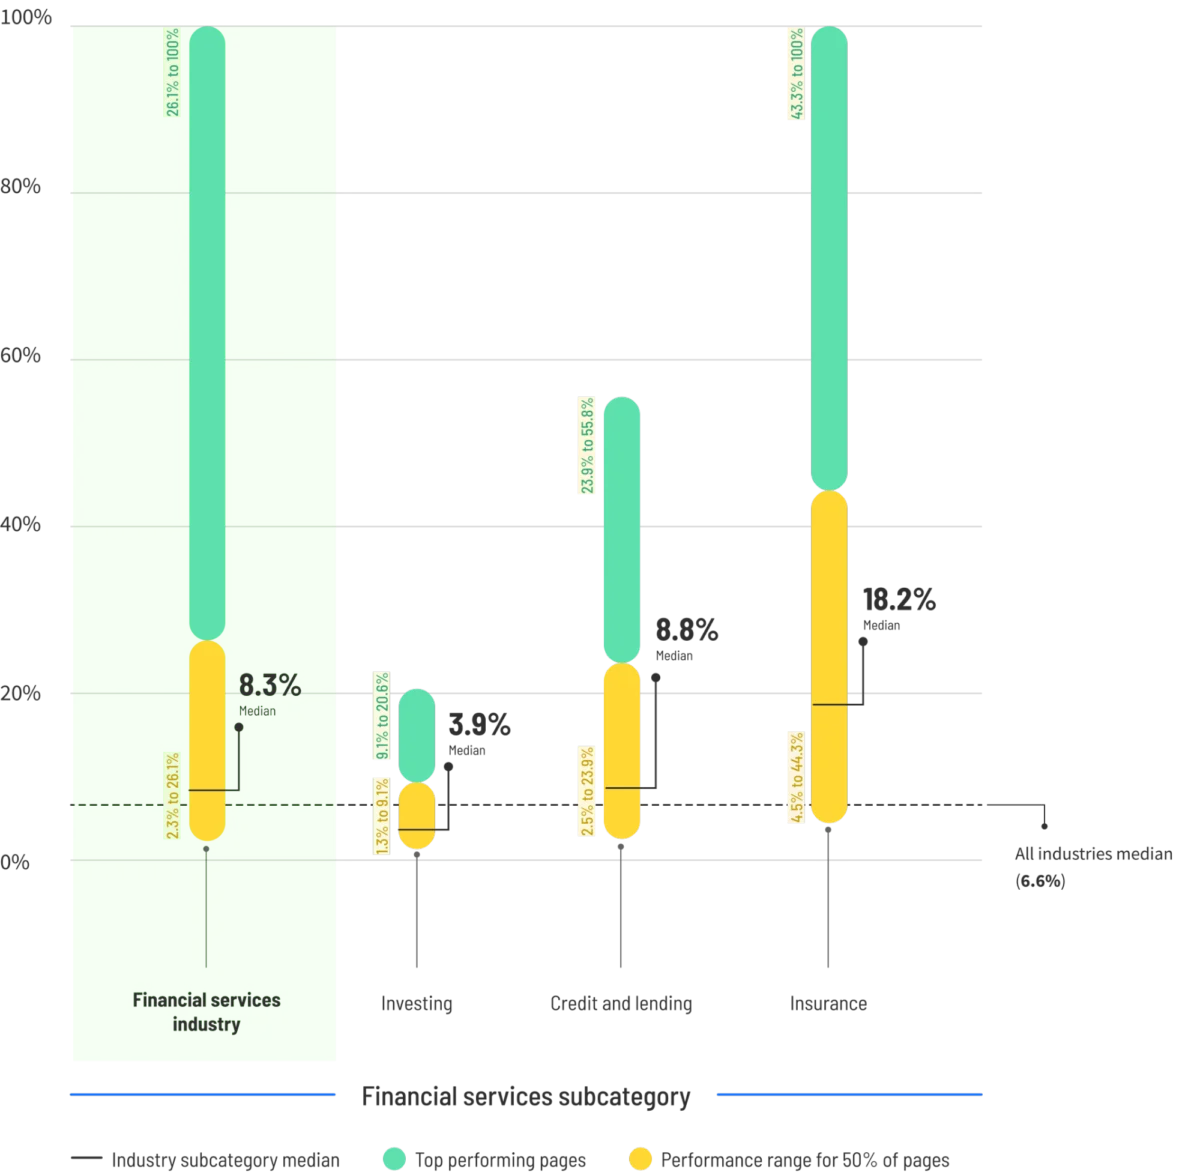
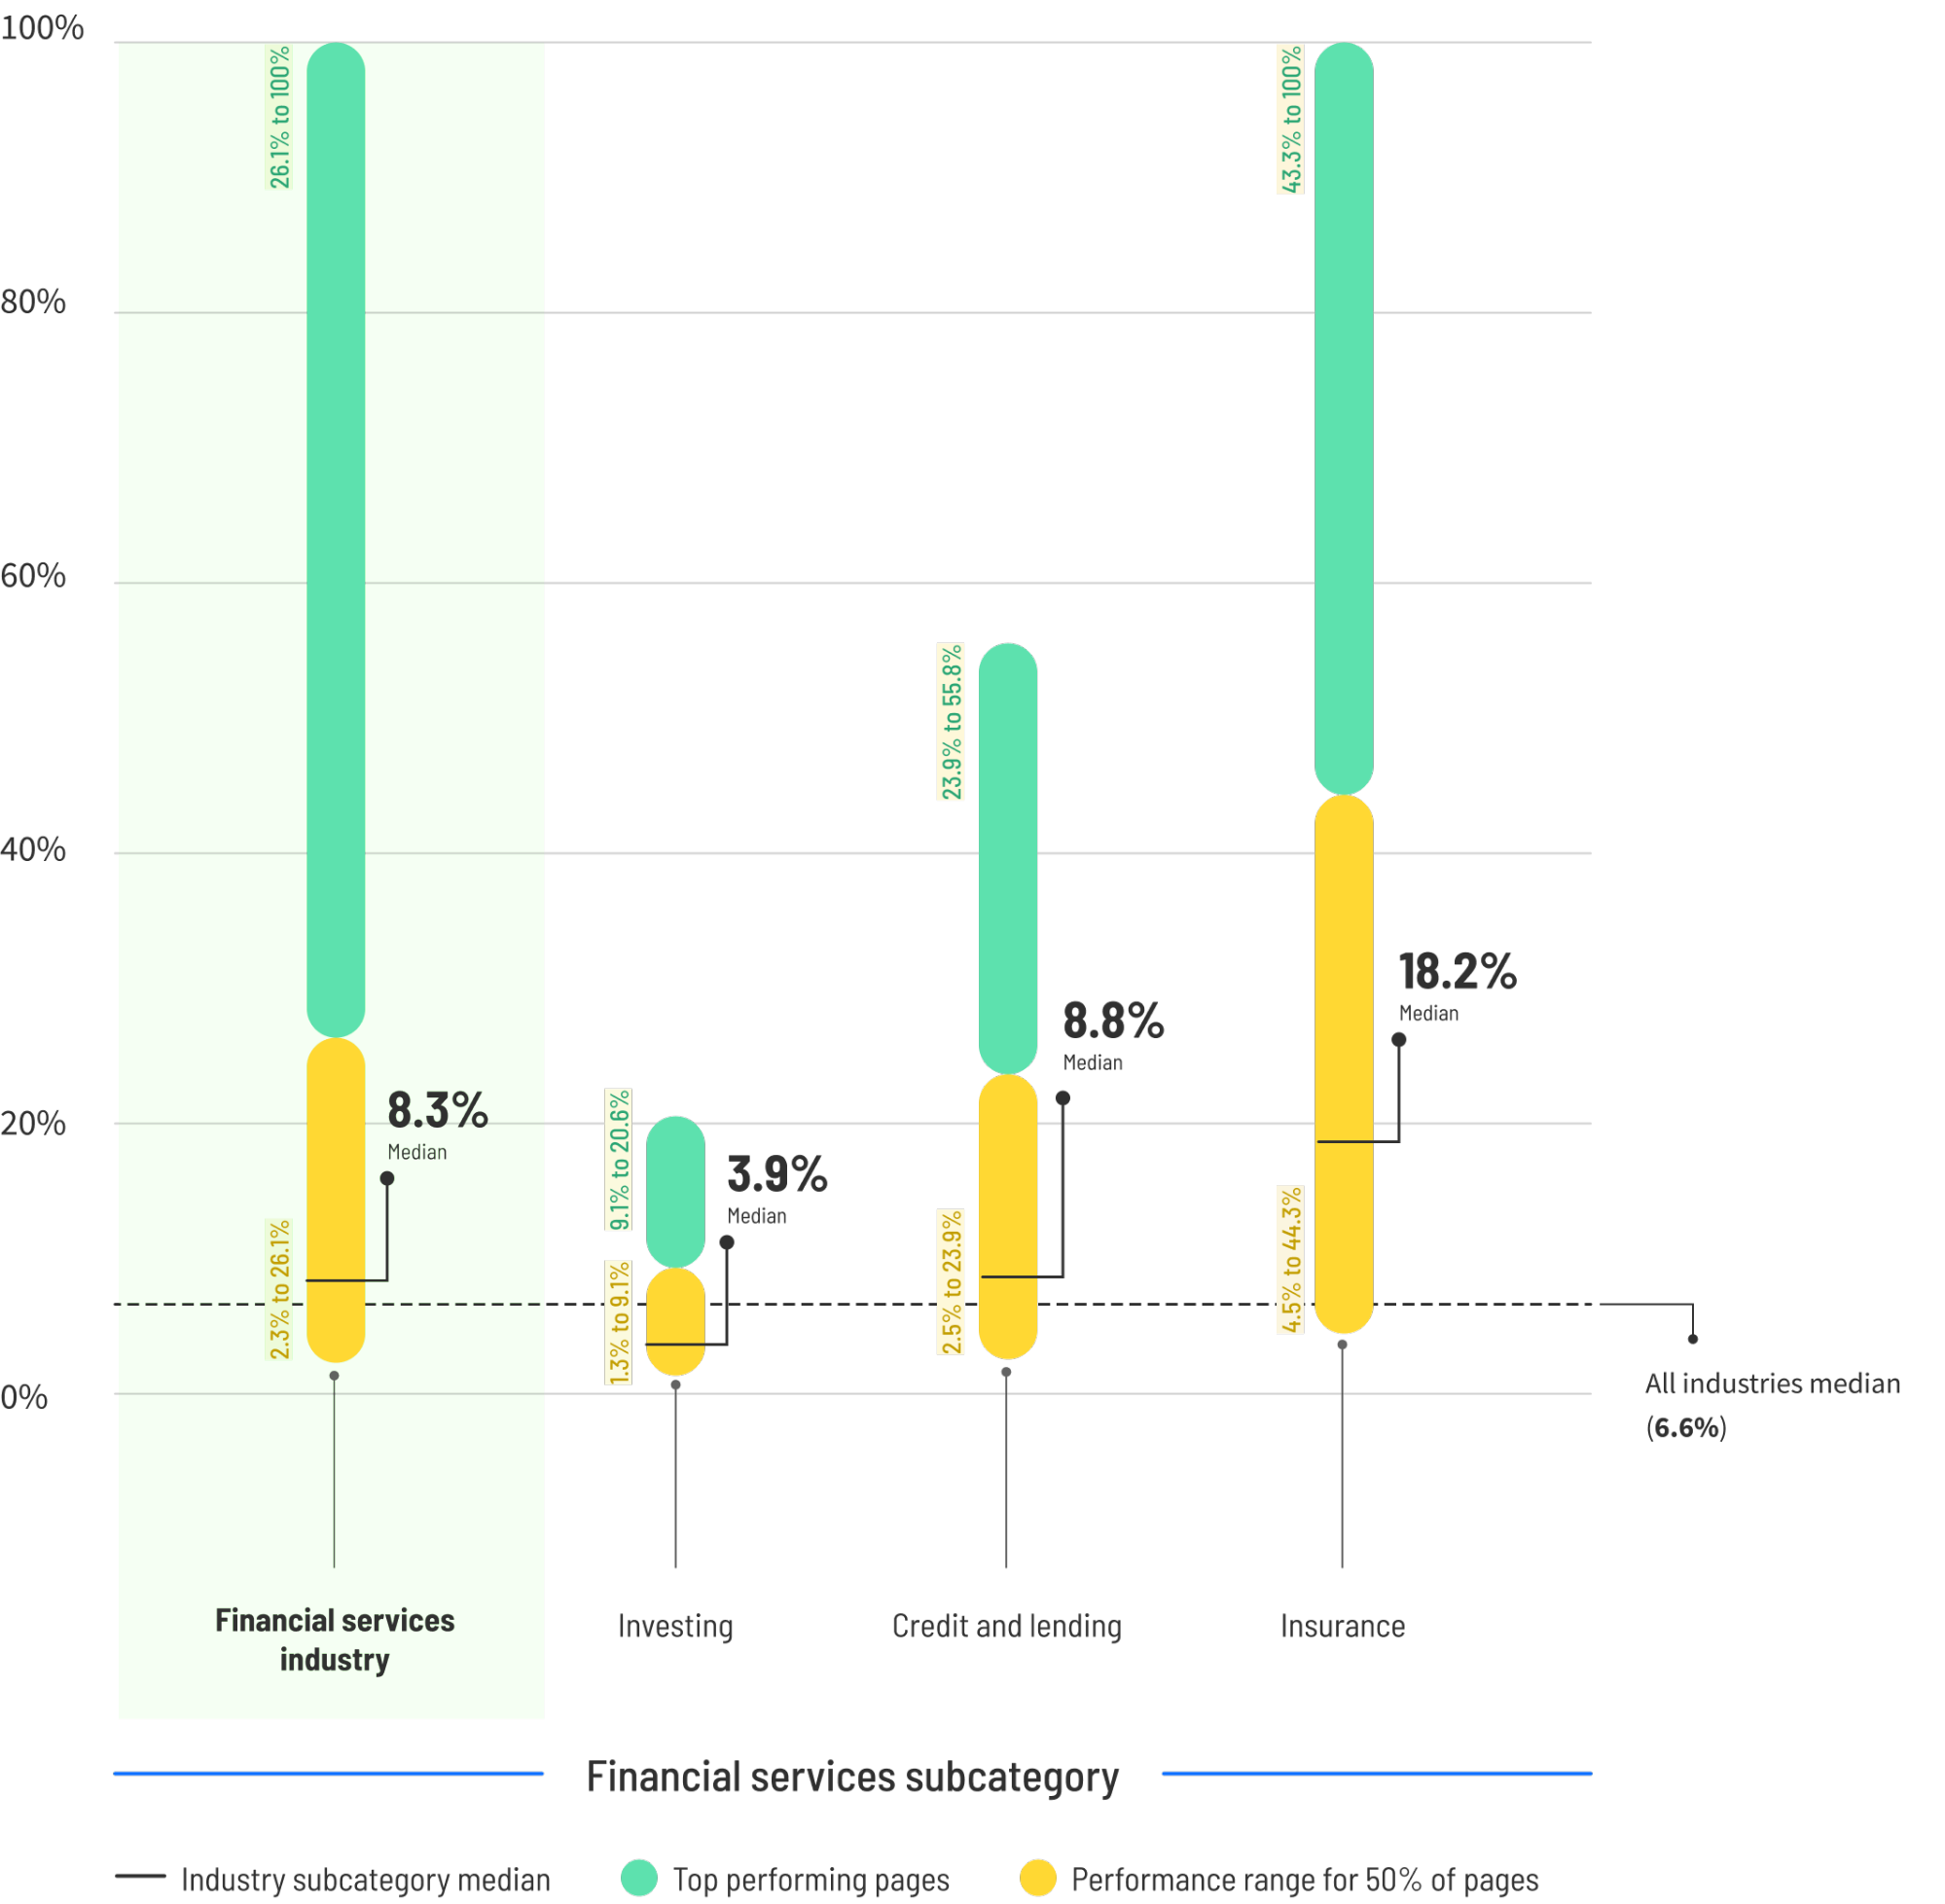
Financial services enjoy a higher median of 8.3%. This is largely due to the high-intent nature of the audience—people rarely search for "insurance" or "investment advice" without a pressing, specific need. Notably, in this sector, mobile traffic actually converts better than desktop, a unique outlier compared to most other industries.
Legal: The Urgency of Now
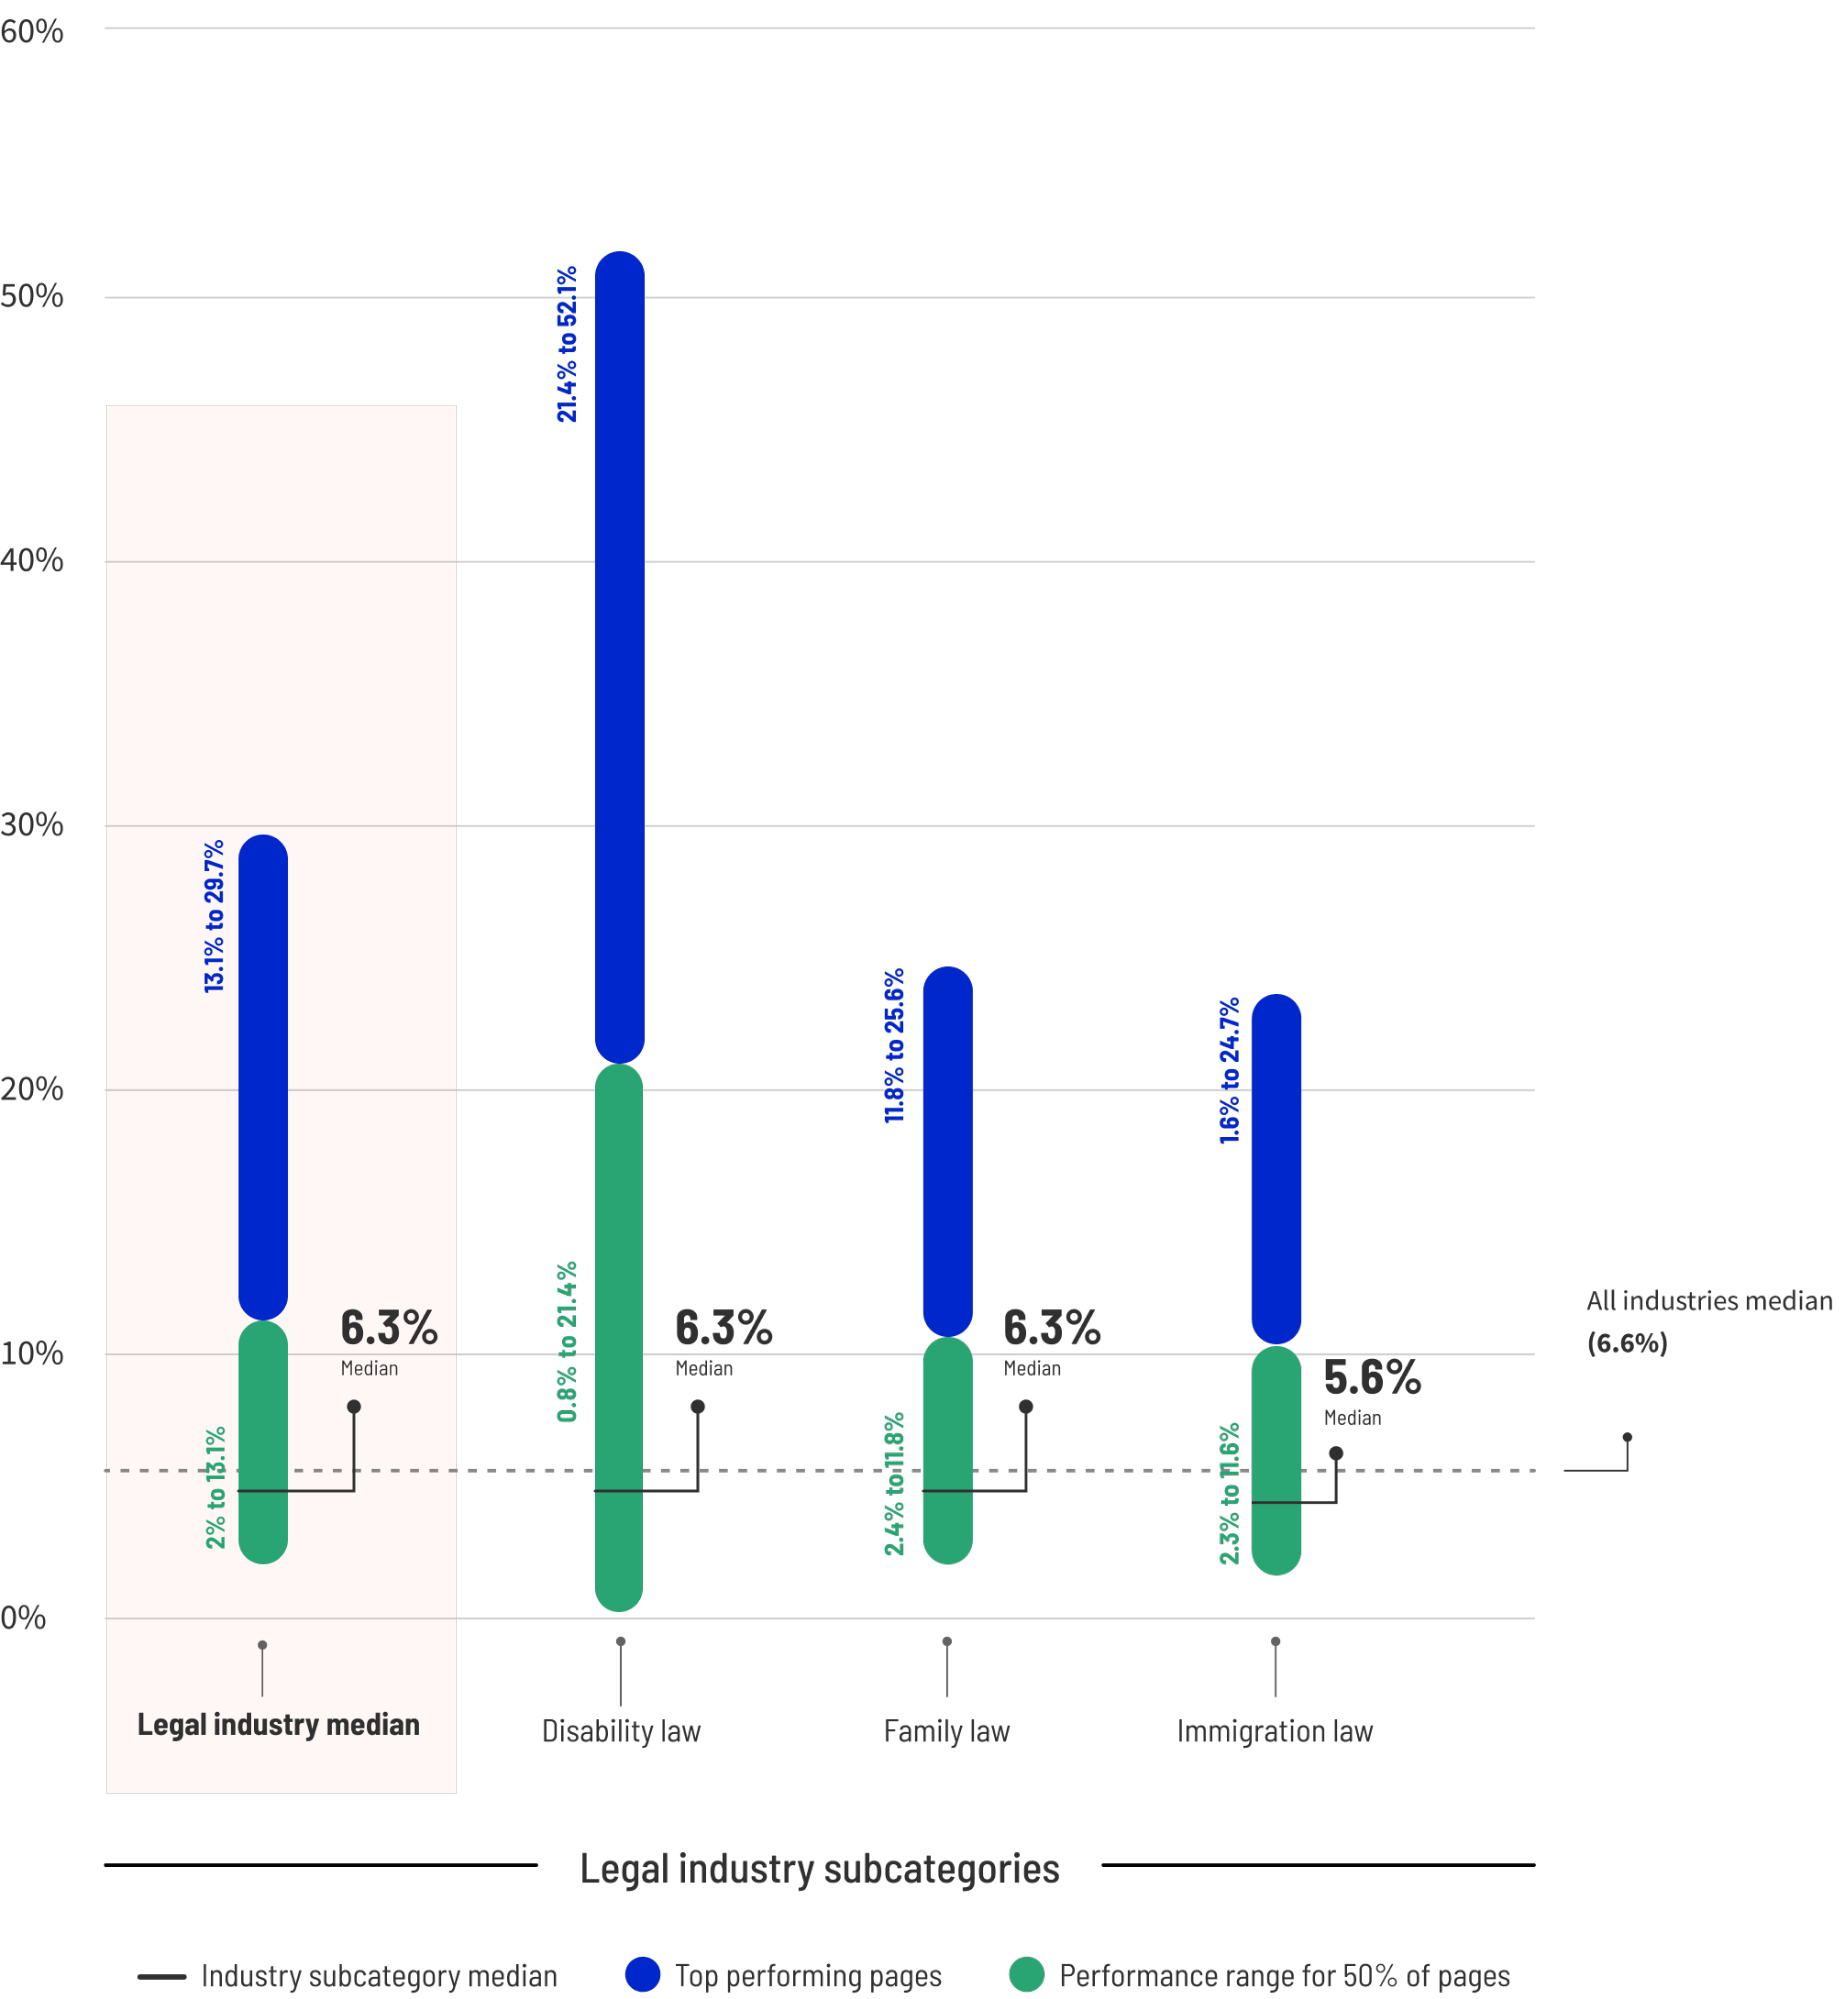
The legal industry sees a median of 6.3%, but top performers hit 13.1%. The secret to success here is speed. Many users are searching in a state of crisis. Consequently, mobile conversion rates in the legal sector (21%) significantly outpace desktop (15.9%). The most successful pages are those that offer immediate, clear pathways to contact.
Education: Selling Transformation
Online course providers are currently the industry leaders in conversion, with some reaching as high as 18.3%. This success stems from selling a clear, tangible transformation—such as learning a new coding language or acquiring a specific certification—rather than a generic educational experience.
Chronology of Optimization: How to Move the Needle
Understanding these benchmarks is only the first step. The journey from "average" to "excellent" is an ongoing process of systematic refinement.
- The Initial Assessment: Benchmark your current performance against the industry median. If you are below 6.6%, your primary goal is to address structural issues, such as page load speed or mobile responsiveness.
- The Testing Phase: Once your baseline is stable, implement A/B testing for specific elements. Never change everything at once; isolate variables like CTA button color, headline copy, or form length to identify what truly moves the needle for your audience.
- Refinement: After identifying successful elements, iterate. The top 25% of performers are rarely "done." They are in a constant cycle of testing and optimization, using data to inform their next design choice.
Supporting Data: Why "Professional" Doesn’t Mean "Better"
A fascinating finding from the 2024 report is the relationship between language complexity and conversion. Data shows that pages written at a 5th-7th grade reading level convert at 11.1%—a staggering 56% improvement over content written for an 8th-9th grade level.
The implication is clear: "Professional" language is often just a synonym for "jargon-heavy." By simplifying your copy and speaking directly to the user’s pain points in plain, accessible language, you remove cognitive friction, making it easier for the visitor to say "yes."
Strategic Implications: Building a Winning Culture
The data from the Unbounce report serves as both a roadmap and a reality check. For businesses looking to scale, the primary takeaway is that the gap between the median and the top 25% is not insurmountable. It is, however, indicative of a difference in methodology.
1. Intent Matching
Successful marketers match their offer to the visitor’s intent. If a user is searching for an emergency solution, your landing page should be focused on immediate contact. If they are in the research phase, your page should provide value-driven content.
2. Eliminating Friction
Every element on your page that does not serve the conversion goal is a distraction. The top-performing pages often strip away navigation bars and social media links, funneling the user toward a single, clear call to action.
3. The Power of Social Proof
Trust is the currency of the digital age. Incorporating testimonials, case studies, or even client logos near your conversion points can significantly increase confidence, especially in high-consideration industries like SaaS or financial services.
Conclusion: The Optimization Journey Never Ends
Benchmarks are not trophies to be won; they are tools to be used. Whether you are a small business owner or a marketing director at a SaaS firm, the goal remains the same: identify your specific industry benchmark, understand the behavior of your unique audience, and commit to an ongoing process of testing and optimization.
The companies capturing the largest market share are not those with the largest budgets; they are those that are most systematic about their approach. By focusing on clarity, removing distractions, and constantly iterating based on real-world data, you can move from the "middle of the pack" to the top 25% of your industry. The opportunity is there—the only question is whether you are prepared to test, learn, and optimize your way to the top.