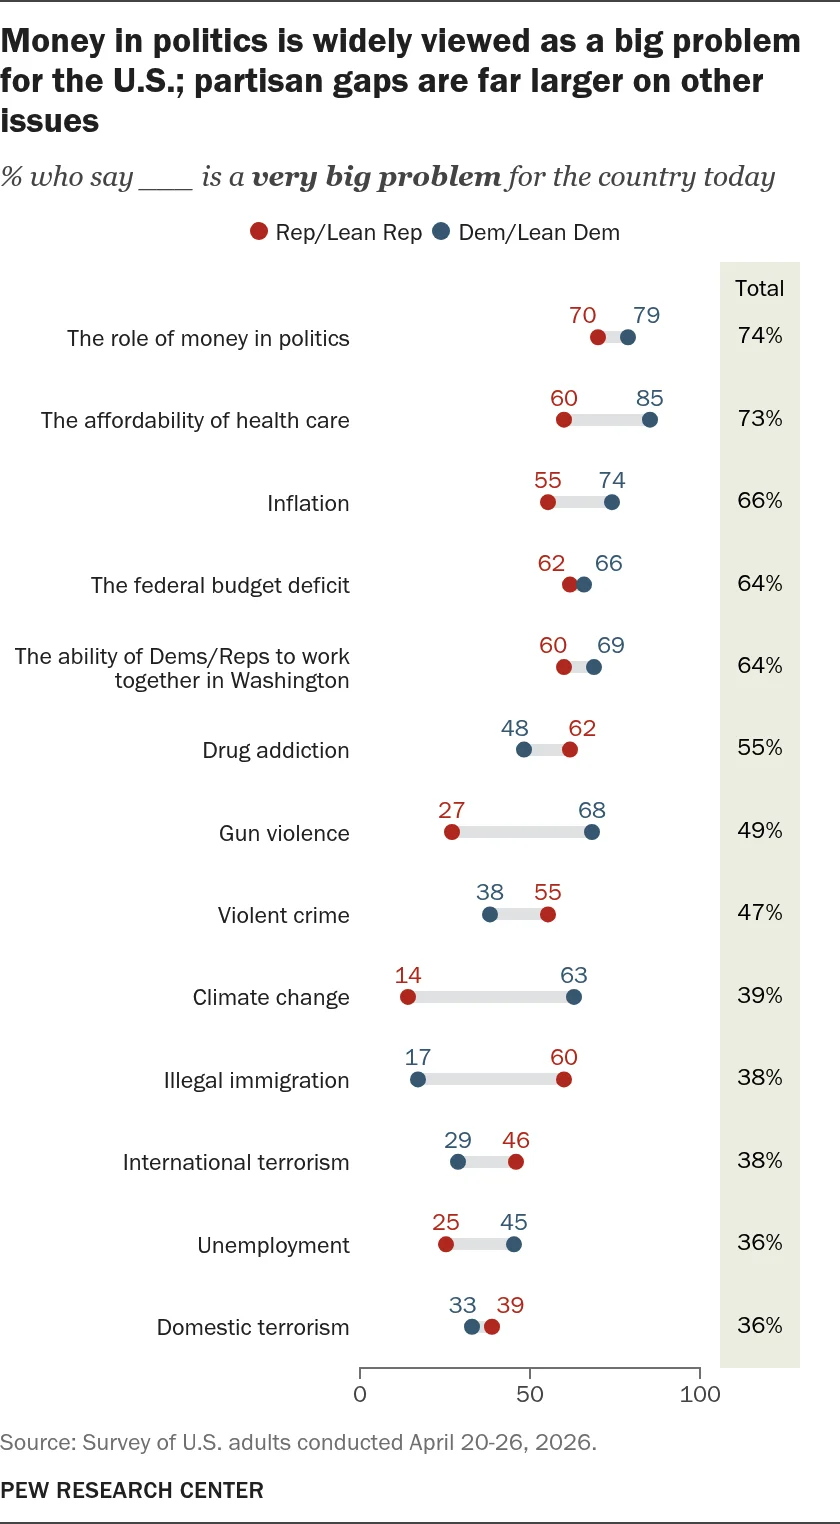

In the era of "big data," the challenge of capturing the genuine pulse of a nation as vast and diverse as the United States has never been more complex. As political landscapes shift and social demographics evolve, the necessity for high-quality, scientifically sound public opinion research becomes paramount. Pew Research Center’s American Trends Panel (ATP) remains a cornerstone of this effort. The release of Wave 192, conducted in April 2026, provides a masterclass in modern survey methodology, offering a transparent look at how researchers navigate the hurdles of representative sampling, nonresponse bias, and technological integration.
Main Facts: The Blueprint of Wave 192
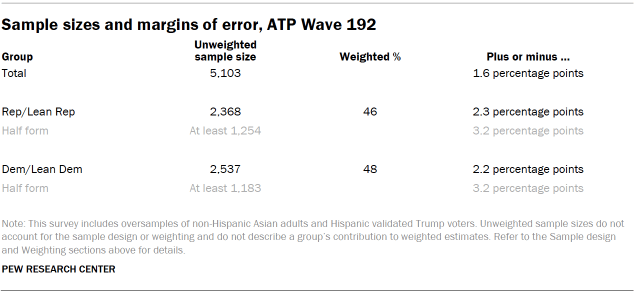
Wave 192 of the American Trends Panel was conducted between April 20 and April 26, 2026, targeting the noninstitutionalized adult population of the United States. The survey successfully engaged 5,103 respondents out of 5,898 sampled, yielding a robust survey-level response rate of 87%.
This wave was characterized by a meticulous effort to ensure inclusivity. Recognizing the inherent difficulty in capturing the perspectives of smaller demographic subgroups, the research team utilized oversampling techniques for non-Hispanic Asian adults and Hispanic validated Trump voters. By intentionally increasing the sample size for these cohorts, researchers were able to produce more precise estimates, which were later statistically weighted back to reflect their true proportions in the general population.
The survey was administered primarily online, accounting for 4,900 respondents, with an additional 203 interviews conducted via live telephone calls. To maximize reach and accessibility, the entire process was bilingual, offering materials in both English and Spanish. With a margin of sampling error at plus or minus 1.6 percentage points, the findings from this wave offer a high degree of statistical confidence, serving as a vital barometer for current national sentiments.

Chronology: A Week of Rigorous Data Collection
The execution of Wave 192 was a highly synchronized operation, spanning seven days of intensive field activity.
April 17: The process began with the mailing of prenotification postcards to panelists slated for telephone interviews, setting the stage for the live engagement phase.
April 20: The official field period commenced with a "soft launch." For online participants, this involved a subset of 60 panelists receiving an initial invitation. Simultaneously, telephone interviewers began their work, conducting calls until a threshold of five successful interviews was met. This soft launch phase is a critical quality-control measure, allowing researchers to test the questionnaire logic, timing, and respondent flow before the full-scale rollout.
April 21: Following the successful soft launch, the full-scale deployment began. Remaining online panelists were sent invitations, and the full cohort of phone-based participants became active. Throughout this period, the methodology prioritized persistent yet ethical engagement, with online users receiving up to two email or SMS reminders, and telephone participants receiving up to six calls from trained professionals.
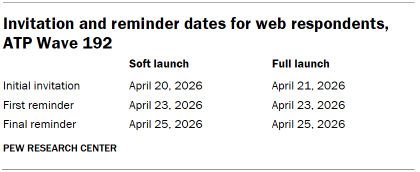
April 22-26: The survey remained open as the team monitored response rates and conducted ongoing quality assurance, ensuring that the data collected remained free from "satisficing"—a phenomenon where respondents provide perfunctory or rushed answers to complete the survey faster.
Supporting Data: The Mechanics of Accuracy
The credibility of the ATP rests on a foundation of sophisticated statistical adjustments and rigorous panel management. Since 2018, the Center has utilized address-based sampling (ABS) to recruit participants. By selecting households randomly from the U.S. Postal Service’s Computerized Delivery Sequence File—which covers an estimated 90% to 98% of the country—the ATP avoids the biases inherent in older, telephone-only recruitment models.
Within each household, the "next birthday" method is used to select an individual respondent, ensuring that the selection process is randomized and not skewed toward those most likely to answer the door or phone.
Once the data is collected, the weighting process begins. This is not merely a summary of raw numbers but a multi-stage calibration:
- Base Weighting: Every respondent is assigned a weight based on their initial probability of being recruited into the panel.
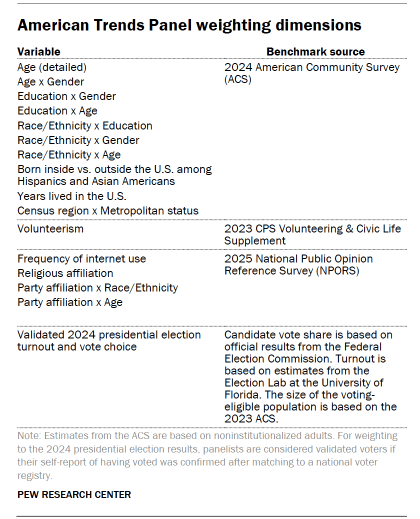
- Calibration: The data is aligned with population benchmarks (such as age, race, education, and geographic distribution) to correct for nonresponse bias.
- Trimming: To prevent extreme weights from skewing the results—a common issue in survey statistics—weights are trimmed at the 1st and 99th percentiles, ensuring that no single respondent exerts an undue influence on the final aggregate.
This meticulous approach extends to the incentives offered. Recognizing that different demographics have different propensities to respond, the ATP offers post-paid incentives ranging from $5 to $15. These are provided as gift codes for major retailers like Amazon, Target, or Walmart, or as physical checks, serving as a tangible gesture of appreciation for the respondent’s time and intellectual labor.
Official Responses and Quality Assurance
The partnership between the Pew Research Center and SSRS (the research firm responsible for data collection) is defined by a commitment to data integrity. Before any survey goes live, the questionnaire undergoes a series of "rigorous tests" on both PC and mobile devices.
In a statement regarding the quality control measures for Wave 192, lead researchers noted that "satisficing" remains a primary concern in survey design. To combat this, data is screened for patterns—such as "straight-lining" (selecting the same answer for every question) or skipping questions at an unusually high rate. In this wave, these checks resulted in the removal of three respondents, ensuring that the final dataset was composed entirely of high-quality, thoughtful contributions.
The researchers also emphasized that while the cumulative response rate—accounting for all stages of recruitment and attrition—sits at 3%, this is a standard metric for longitudinal panels. The focus remains on the representativeness of the sample rather than the sheer volume of respondents, a distinction that separates academic-grade polling from less reliable, convenience-based internet surveys.
Implications: Why Methodology Matters
The implications of the ATP’s methodology for Wave 192 extend far beyond the raw numbers. In a fragmented media and political environment, the public’s trust in polling is often fragile. By providing a "glass box" approach—where the sampling design, weighting, and error-correction protocols are fully disclosed—Pew Research Center sets a standard for transparency that serves as a bulwark against misinformation.
The use of oversampling is particularly significant. By ensuring that underrepresented groups, such as non-Hispanic Asian adults, are accurately captured, the ATP provides a more nuanced view of the American experience. This prevents the "tyranny of the majority" in data, where smaller but vital segments of the population are drowned out by larger demographic blocks.
Furthermore, the decision to maintain a bilingual, multi-modal (online and phone) approach acknowledges the reality of the digital divide. While the vast majority of respondents are comfortable with online surveys, the continued use of live telephone interviews ensures that those who are less digitally integrated are not systematically excluded from the national conversation.
As we look toward future waves of the American Trends Panel, the methodology of Wave 192 serves as a reminder that good research is not just about asking the right questions; it is about building a framework that ensures every voice is heard with equal clarity. In an age where data is often weaponized, the rigorous, transparent, and methodical pursuit of truth remains the most powerful tool in the public interest.