By Financial Analysis Desk
January 8, 2026
The United States trade deficit experienced a significant contraction in October 2026, signaling a potential shift in the nation’s international commerce dynamics. According to the latest data released jointly by the U.S. Census Bureau and the Bureau of Economic Analysis (BEA), the deficit in goods and services plummeted to $29.4 billion. This figure represents a substantial $18.8 billion improvement from the revised September deficit of $48.1 billion, reflecting a rare combination of surging exports and cooling import demand.
The Core Data: A Two-Fold Adjustment
The October trade figures provide a compelling narrative of market recalibration. The narrowing of the deficit was driven by two distinct movements: an increase in the value of outbound goods and services, and a retreat in the value of inbound shipments.
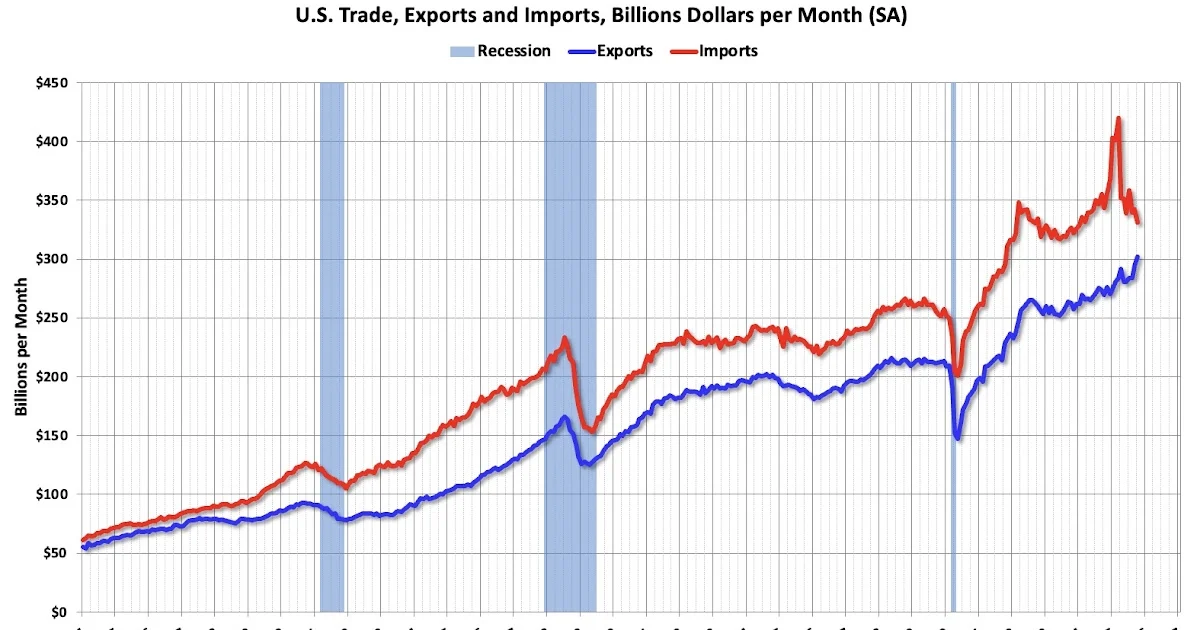
Total U.S. exports for the month reached $302.0 billion, an increase of $7.8 billion compared to the previous month. Conversely, imports fell to $331.4 billion, marking a decline of $11.0 billion from September levels. When viewed on a year-over-year basis, the trends become even more pronounced: exports have climbed by 12%, while imports have retracted by 4%.
This cooling in import volume is widely attributed by economists to the dissipation of "front-loading" behaviors. Throughout the earlier months of 2026, domestic importers aggressively increased their orders to preempt the implementation of looming tariffs. With those policies now integrated into the market reality, the frantic pace of inventory accumulation has stabilized, contributing directly to the reduced import figures observed in the October report.
Chronology of the 2026 Trade Environment
To understand the significance of the October numbers, one must examine the volatility of the preceding months.
- Q1-Q2 2026: The Tariff Preemption Phase. Throughout the first half of the year, the U.S. trade deficit faced upward pressure as businesses scrambled to secure supply chains. Importers, fearing significant cost hikes due to new trade barriers, increased foreign procurement, leading to record-high import volumes.
- Q3 2026: Market Saturation. By the late summer, domestic warehouses were reporting near-capacity levels. The surge in imports began to plateau as the logistical costs of storing excess inventory began to outweigh the perceived benefits of beating future tariffs.
- October 2026: The Reversal. The current data represents the most decisive shift in the trade balance this year. The decline in the deficit is not merely a statistical anomaly but a reflection of the "post-rush" economic environment, where export growth is finally beginning to outpace the now-moderated appetite for foreign goods.
Supporting Data: Petroleum and Regional Dynamics
A deeper dive into the trade components reveals that the U.S. energy sector is playing a pivotal role in narrowing the deficit.

The U.S. has successfully pivoted from being a net importer of petroleum to a consistent net exporter. The data indicates that net exports of petroleum products have continued to rise, providing a crucial buffer against the broader trade deficit. In the graphical analysis provided by industry observers, the gap between the total trade deficit and the "ex-petroleum" deficit continues to widen, underscoring the dominance of the American energy sector in balancing the national trade ledger.
Furthermore, the bilateral trade relationship with China has undergone a dramatic transformation. The deficit with China—a long-standing focal point of geopolitical and economic discourse—dropped to $14.9 billion in October, down from $28.1 billion in the same month a year prior. This reduction of nearly 47% is indicative of a broader diversification of supply chains, as American companies continue to explore alternative manufacturing hubs in Southeast Asia, Mexico, and domestic facilities.
Official Responses and Economic Interpretations
While the government bureaus strictly provide the raw data, the implications have drawn comment from various corners of the financial establishment. Treasury officials have remained characteristically cautious, emphasizing that monthly fluctuations in trade data should not be interpreted as long-term structural changes.
"The October figures reflect a normalization of supply chain logistics following a period of intense anticipation regarding trade policy," stated a spokesperson for the Department of Commerce. "While the narrowing of the deficit is a positive signal for the balance of payments, we continue to monitor global demand patterns and the competitiveness of U.S. manufacturing in international markets."
Private sector analysts are more optimistic. Many point to the 12% year-over-year increase in exports as a sign that U.S.-made products—particularly in high-tech machinery, agriculture, and energy—remain highly competitive despite a strong dollar. "The fact that we are exporting more while simultaneously shedding the excess inventory brought on by tariff-dodging is a ‘best-case scenario’ for trade stability," noted a senior economist at a major investment firm.
Implications for the Future
The shrinking trade deficit carries significant weight for the U.S. economy moving into 2027.
1. Currency Impact
A narrowing trade deficit typically reduces the need for the U.S. to borrow from foreign nations to finance its consumption, which can impact the value of the dollar. If the deficit continues to trend downward, it may alter the Federal Reserve’s calculus regarding interest rates, as it reduces the reliance on foreign capital inflows.

2. Manufacturing Renaissance
The shift away from reliance on Chinese imports suggests that the "reshoring" or "near-shoring" initiatives are beginning to yield measurable results. As businesses settle into these new logistics networks, the volatility seen in the first half of 2026 is expected to stabilize, potentially leading to more predictable manufacturing cycles and domestic job growth.
3. Inflationary Pressures
One of the primary concerns regarding the tariff-heavy landscape of 2026 was the risk of "imported inflation." However, with the import rush cooling and supply chains finding a new equilibrium, the inflationary pressure caused by supply-side shocks may begin to ease. Consumers may see more stability in prices for goods, as the supply chain stress that characterized the start of the year continues to dissipate.
4. Global Geopolitical Relations
The reduction in the deficit with China serves as a critical indicator of the "de-risking" strategy currently favored by U.S. policymakers. As the two nations navigate a complex relationship, the trade data serves as a barometer for how successful the U.S. has been in decoupling its critical supply chains from geopolitical rivals.
Conclusion
The $29.4 billion trade deficit reported for October is a landmark figure that underscores the resilience of the U.S. economy. By successfully navigating the turbulent waters of tariff-related inventory surges and leveraging its energy independence, the United States has achieved a significantly improved trade position.
While the volatility of the past year reminds us that international commerce is subject to rapid shifts, the October data provides a roadmap for a more balanced future. As the U.S. continues to increase its export footprint and diversify its import partners, the nation is positioning itself to be less susceptible to the supply chain shocks that defined the beginning of 2026. The coming months will be crucial in determining whether this contraction is a temporary correction or the beginning of a sustained trend toward a more sustainable and robust national trade balance.
Investors, policymakers, and industry leaders will be watching the upcoming November and December reports with keen interest to see if this trend of narrowing deficits holds firm, or if the global market introduces new variables into the complex equation of international trade.