Introduction: A Steady Finish to the Year
The wholesale used vehicle market concluded 2025 on a note of cautious stability, according to the latest data from the Manheim Used Vehicle Value Index (MUVVI). As of January 8, 2026, reports indicate that wholesale used vehicle prices—after adjusting for mix, mileage, and seasonality—posted a modest increase in December. This shift signals a departure from the volatility that characterized the automotive sector in previous years, reflecting a market that is increasingly finding its equilibrium in a post-pandemic economic landscape.
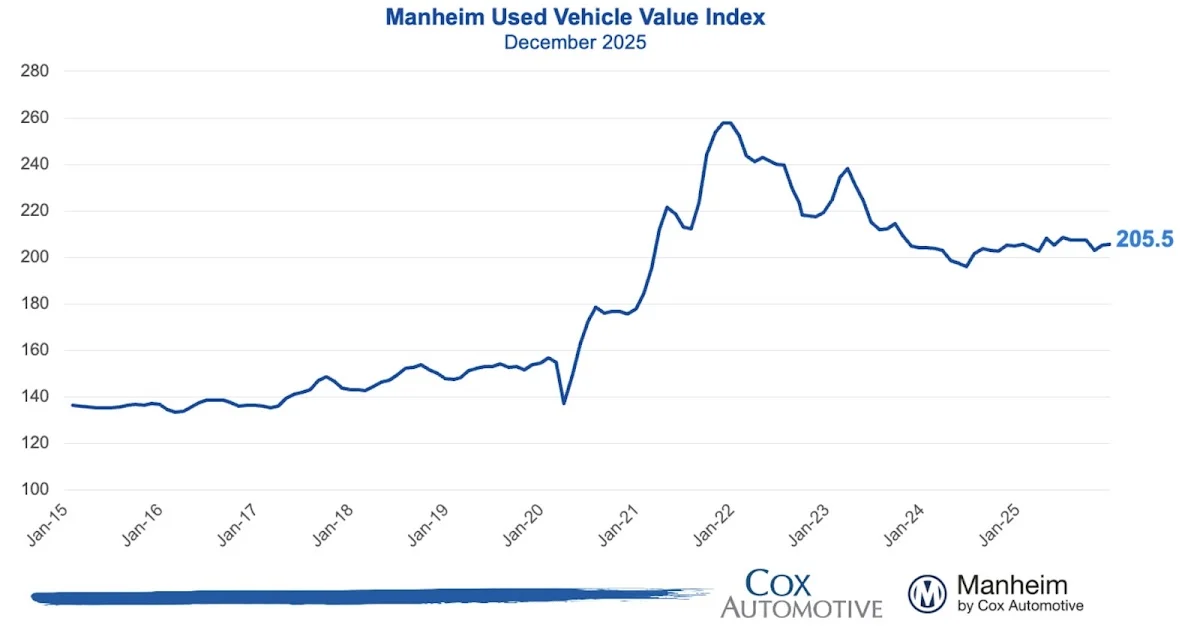
For consumers, dealerships, and automotive stakeholders, the December data provides a crucial snapshot of supply-demand dynamics. With the MUVVI reaching 205.5, the industry is witnessing a subtle upward trend that, while not explosive, suggests that the precipitous declines seen in earlier periods have bottomed out, giving way to a period of incremental recovery and price consolidation.
Main Facts: Decoding the December Index
The headline figures from Manheim Consulting offer a clear, albeit nuanced, view of the wholesale market. The key takeaways from the December 2025 report are as follows:
- Year-Over-Year Growth: Wholesale used vehicle prices rose by 0.4% compared to December 2024.
- Month-Over-Month Momentum: The index saw a marginal increase of 0.1% from November to December 2025.
- Index Standing: The Manheim Used Vehicle Value Index reached 205.5, a metric derived from the massive volume of transactions occurring across Manheim’s U.S. auction network.
- Methodological Integrity: These figures are seasonally adjusted and account for variations in vehicle mix and mileage, ensuring that the data reflects true market value shifts rather than skewed inventory profiles.
These figures are particularly significant because they represent a departure from the "normalization" narrative that dominated much of 2024, where market analysts expected a sharper correction in used car valuations. Instead, the market has demonstrated a surprising degree of resilience, holding onto value even as new vehicle production levels have largely stabilized.
Chronology: The Road to December 2025
To understand the significance of the December data, one must look at the trajectory of the automotive market over the past 24 months.
2024: The Year of Correction
Throughout 2024, the automotive sector spent most of its energy correcting the anomalies of the 2021–2022 supply chain crisis. As chip shortages eased and new car inventory returned to dealership lots, the demand for used vehicles—which had been inflated due to scarcity—began to wane. Wholesale prices throughout 2024 were largely characterized by a "soft landing," where values retreated from the historic highs seen during the height of the inflation surge.
2025: The Search for a Floor
The first half of 2025 was marked by market uncertainty. High interest rates, which peaked in the latter half of the year, put significant pressure on the affordability of both new and used vehicles. Consumers, grappling with the cost of financing, retreated to the sidelines or opted for older, more reliable vehicles rather than late-model inventory.
By mid-2025, auction data began to show a stabilization pattern. Rather than a continued freefall, wholesale values began to flatten. Analysts noted that the "mix" of vehicles hitting the auction block was changing; as fleets turned over and rental companies rebalanced their inventories, the supply side of the equation became more predictable. By the time Q4 2025 arrived, the market had entered a "holding pattern," which ultimately led to the slight 0.4% year-over-year increase observed in December.
Supporting Data: Why the Index Matters
The Manheim Used Vehicle Value Index is widely regarded as the "gold standard" for tracking wholesale automotive pricing in the United States. Its methodology is based on millions of completed sales transactions, providing a depth of data that is difficult to replicate.
Understanding "Adjusted" Data
Critics often ask why the index does not simply track the "average price" of a car sold at auction. The answer lies in the variables of mix, mileage, and seasonality.
- Mix: If a higher proportion of luxury SUVs is sold in a given month compared to compact sedans, the raw average price would jump. The index filters this out to show if the same vehicle is worth more or less than it was previously.
- Mileage: Older, high-mileage vehicles depreciate faster. By adjusting for mileage, Manheim ensures that the index reflects the underlying value of the vehicle’s "market desirability."
- Seasonality: The automotive market is inherently cyclical. December often sees different purchasing behaviors than July. The seasonal adjustment ensures that the index measures true growth or decline rather than predictable calendar-based fluctuations.
The 205.5 reading in December is not merely a number; it is a reflection of a supply chain that has regained its efficiency. When the index remains flat or moves incrementally, it suggests that the "bid-ask" spread between sellers (dealerships and rental fleets) and buyers (independent used car lots) has narrowed, allowing for more consistent deal flow.

Official Responses and Industry Outlook
While Manheim Consulting acts as the primary data aggregator, the broader automotive industry has responded to these trends with a mix of relief and caution.
Dealership Perspectives
For the average franchise dealer, a stable wholesale market is a welcome development. In years where prices fluctuate wildly, dealers risk "negative equity" on their trade-ins—buying a vehicle for a price that drops significantly by the time the car is reconditioned and listed for sale. The marginal increase seen in December suggests that dealers can price their retail inventory with greater confidence, knowing that the floor for wholesale acquisition has not fallen out.
Financial Sector Implications
Lenders and credit unions, which underpin the vast majority of vehicle financing, have closely watched the index. High wholesale values are a double-edged sword: they maintain the value of existing loan portfolios, but they also keep the entry price for consumers prohibitively high. The consensus among financial analysts is that the current 0.4% year-over-year increase represents a "sustainable" valuation environment, which is less likely to trigger the credit defaults that would accompany a sudden crash in vehicle values.
Implications: What Does This Mean for 2026?
As we enter 2026, the data from the final month of 2025 provides a roadmap for the year ahead.
1. The Affordability Gap
The most immediate implication of a 0.4% increase in wholesale prices is that the "used car affordability crisis" is not over. With wholesale prices holding steady or rising slightly, consumers should not expect significant relief in the form of lower retail prices in the short term. The cost of entry into the used vehicle market remains elevated compared to pre-2020 standards.
2. Fleet Replenishment
The rental and corporate fleet sectors are continuing their replenishment cycles. As these vehicles enter the auction stream, they provide a steady supply that prevents wholesale prices from spiking. However, this also means that the "bargain" phase of the used car market—where buyers could pick up late-model vehicles at steep discounts—is largely a thing of the past.
3. Impact of Electrification
A hidden variable in the 2026 outlook is the growing presence of electric vehicles (EVs) in the wholesale channel. As the first generation of mass-market EVs reaches the 3-to-5-year-old mark, their performance in the auction ring is influencing the overall index. Because EVs have shown higher price volatility due to battery health concerns and rapid technological updates, their increasing share of the index will be a key factor to watch throughout 2026.
4. Interest Rate Sensitivity
The Federal Reserve’s interest rate policy will remain the primary external force acting upon these numbers. If borrowing costs remain high, demand for used vehicles—which are typically financed with higher-interest loans than new cars—could soften, potentially putting downward pressure on the index in the first quarter of 2026.
Conclusion: A New Era of Predictability
The December 2025 report from Manheim serves as a testament to the maturation of the used vehicle market. After years of chaos, characterized by supply chain collapses, record-breaking price spikes, and subsequent corrections, the market appears to have found a stable footing.
A 0.4% year-over-year increase is not a signal of a new bubble, but rather an indicator of a healthy, functioning marketplace where supply and demand have achieved a tenuous but functional harmony. For the consumer, this means that while prices are unlikely to plummet, the extreme instability of the past is fading. For the industry, the focus shifts from managing crisis to managing margins. As 2026 unfolds, the automotive sector will continue to lean on the Manheim index to navigate what promises to be a year of measured, deliberate, and predictable growth.
The industry enters 2026 not with the uncertainty of the past, but with the data-driven confidence required to navigate a normalized, if expensive, automotive landscape. Whether this equilibrium persists will depend on macroeconomic factors, but for now, the wholesale market is holding firm.