By Industry Analysis Desk
January 11, 2026
The United States hotel industry has signaled a potential shift in momentum as it enters the new year. According to the latest data released by CoStar, the hospitality sector reported a notable 4.4% year-over-year increase in occupancy for the week ending January 3, 2026. While industry analysts caution against reading too much into the data during the historically sluggish post-holiday window, the numbers provide a welcome contrast to the tepid performance that characterized much of the 2025 calendar year.
As stakeholders assess the landscape for the year ahead, this early uptick in demand, paired with modest growth in pricing power, suggests that the sector may be finding a firmer footing.
Main Facts: A Strong Start to the New Year
The data covering the week of December 28, 2025, through January 3, 2026, presents a multi-faceted picture of industry health. Across the U.S. market, occupancy reached 50.5%, marking a 4.4% increase compared to the corresponding period in the previous year.
However, occupancy is only one component of the broader revenue puzzle. The industry also saw a healthy increase in the Average Daily Rate (ADR), which climbed to $175.47, representing a 3.4% rise over the same period. When these two metrics are combined, they produce the industry’s most critical performance indicator: Revenue per Available Room (RevPAR). For the first week of January, RevPAR reached $88.65, a robust 7.9% increase year-over-year.
These figures are particularly significant given that 2025 was widely regarded as a year of "weak" performance for the hotel sector. The industry spent much of the past twelve months grappling with economic uncertainty, inflation, and shifting consumer travel patterns. This initial data point for 2026 acts as a litmus test for whether the market can sustain a recovery or if the early gains are merely a statistical anomaly driven by the calendar shift of the holiday season.
Chronology: Navigating a Challenging 2025
To understand the significance of the 2026 opening figures, one must view them through the lens of the preceding year. 2025 was a year of stagnation for the U.S. hospitality market. Following the post-pandemic surge in travel—often termed "revenge travel"—the industry faced a reality check as consumer budgets tightened under the pressure of sustained interest rates and elevated cost-of-living expenses.
- Q1 2025: The industry began the year with cautious optimism, but occupancy rates struggled to regain the peaks seen in 2018, which remains the high-water mark for the modern U.S. hotel industry.
- Q2–Q3 2025: Throughout the peak summer travel season, hotels faced stiff competition from alternative lodging platforms and a noticeable shift toward shorter, more budget-conscious trips. Occupancy figures remained largely flat compared to 2024.
- Q4 2025: As the year closed, the hospitality sector showed signs of fatigue. Many operators reported that corporate travel, a key pillar of mid-week occupancy, had not returned to the anticipated levels, leading to a focus on leisure travel to pad bottom lines.
The transition from the final week of December 2025 into the first week of 2026 has been marked by a return to normal business patterns. Analysts note that early January is historically the "quietest" period for the industry, as leisure travel drops off sharply following the New Year’s celebrations and business travel has yet to ramp up in earnest. Therefore, the 4.4% increase is being scrutinized to see if it represents a genuine reversal of the 2025 malaise or a temporary artifact of seasonal timing.
Supporting Data: Understanding the Metrics
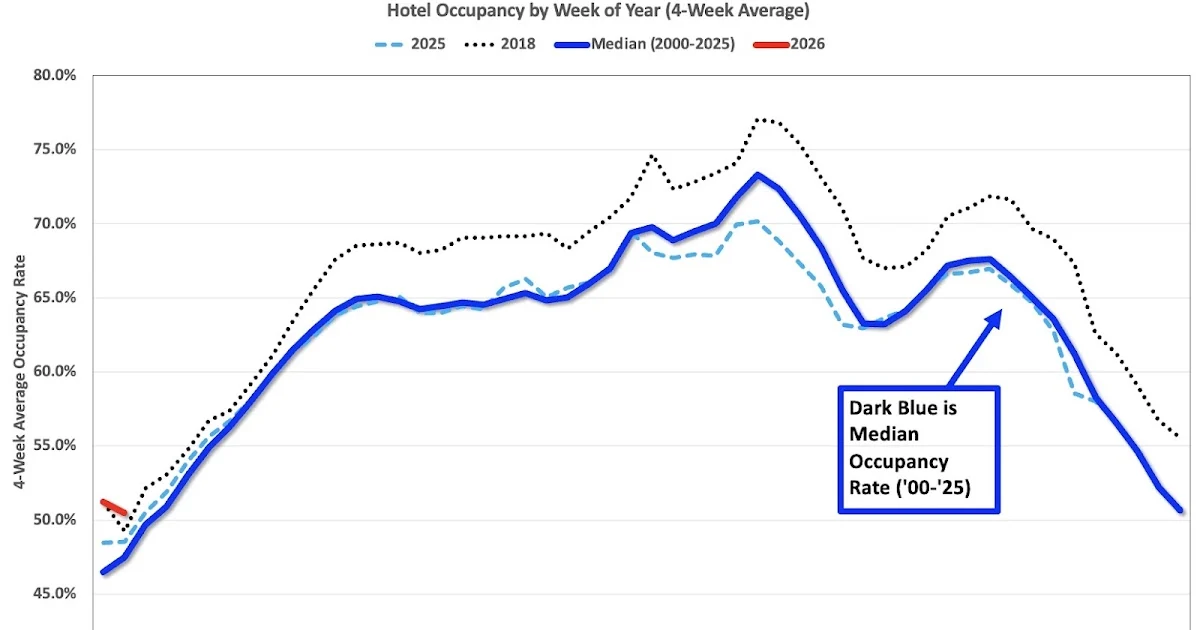
The CoStar data is visualized through a four-week moving average, a methodology that helps strip away the extreme volatility associated with single-week performance metrics. By smoothing out the data, analysts can better identify underlying trends.
In the current model, the trajectory of the 2026 red line on the industry chart is being compared against several benchmarks:
- The Median: This provides the "normal" baseline for any given week.
- The 2025 Baseline: The dashed light blue line, representing the lackluster performance of the previous year, serves as the primary hurdle for the current market.
- The 2018 Record: The dashed black line represents the industry’s peak performance year. For the market to be considered "recovered" in a true sense, current performance must begin to narrow the gap between the current trend lines and this 2018 benchmark.
The current analysis suggests that while the industry is climbing, it is doing so from a point of relative weakness. The Y-axis of these performance charts is intentionally truncated to avoid the distortion of starting at zero, allowing analysts to focus on the marginal changes that define profitability in the hotel space. As we move through the first quarter of 2026, the four-week average is expected to climb seasonally, a trend that will provide a clearer picture of whether the 7.9% RevPAR growth is sustainable or a short-lived spike.

Official Responses and Industry Outlook
Industry stakeholders have been characteristically cautious in their responses to the latest data. While a 7.9% jump in RevPAR is objectively positive, the hospitality sector is hyper-aware of the macroeconomic headwinds still blowing across the U.S. economy.
"The numbers for the first week of January are encouraging, but we must be careful not to conflate a strong start with a full-year trend," says one industry consultant. "The hospitality industry is highly sensitive to discretionary spending. If the broader economy remains resilient, we may see a consistent growth pattern throughout 2026. If, however, inflation or labor costs continue to squeeze margins, the 3.4% increase in ADR may not be enough to satisfy owners and investors."
Hotel operators are also keeping a close watch on labor costs and supply chain constraints, which have historically dampened the benefits of increased occupancy. In 2025, many hotels found that even when occupancy was stable, the cost of staffing and maintaining properties kept net operating income under pressure. The goal for 2026 is to leverage the increased occupancy to improve operational efficiency.
Implications: What This Means for the Year Ahead
The implications of these early 2026 figures are significant for both the hotel sector and the broader travel economy.
1. Consumer Behavior Shifts
If occupancy continues to grow at this rate, it suggests that consumers have not yet hit a "travel ceiling." Despite economic concerns, the appetite for travel remains a high priority for U.S. households. This is a critical indicator for the broader leisure economy, including airlines, car rental agencies, and local tourism boards.
2. Pricing Power
The 3.4% increase in ADR, while modest, suggests that hotels are successfully passing on costs to consumers. This pricing power is essential for the industry’s ability to reinvest in properties, renovate, and maintain high service standards. However, if ADR grows too quickly, it risks pricing out the budget-conscious traveler, potentially leading to a decline in occupancy later in the year.
3. Investor Confidence
For Real Estate Investment Trusts (REITs) and private equity firms invested in hospitality, the first-week data is a positive sign for the 2026 fiscal year. Strong RevPAR growth is the primary driver of hotel valuation. If this trend holds through the end of the first quarter, we may see an increase in capital deployment toward hotel acquisitions and new developments, which have been somewhat stagnant over the last 18 months.
4. The Business Travel Variable
A major unknown remains the recovery of business travel. While the early January numbers are driven largely by the tail end of holiday leisure travel, the coming months will test the return of the corporate traveler. If businesses continue to favor remote meetings over in-person conferences, the industry will need to continue its pivot toward "bleisure"—the blending of business and leisure—to fill mid-week occupancy gaps.
Conclusion
The first week of 2026 has provided the U.S. hotel industry with a much-needed morale boost. A 4.4% increase in occupancy and a 7.9% increase in RevPAR serve as a foundational, albeit early, indicator of potential recovery.
While the ghost of 2025’s weak performance lingers, the industry is entering the new year with a clearer understanding of the challenges ahead. Success in 2026 will likely depend on the ability of operators to balance the rising costs of service with the willingness of consumers to pay a premium for their travel experiences. As the four-week average begins its seasonal ascent, the eyes of the financial world will remain fixed on these metrics, waiting to see if this early momentum can evolve into a sustained period of growth for the American hospitality sector.