By Economic Analysis Desk
January 8, 2026
The U.S. economic landscape witnessed a notable shift in international trade dynamics this October, as the combined goods and services deficit contracted to $29.4 billion. According to the latest data released by the U.S. Census Bureau and the U.S. Bureau of Economic Analysis (BEA), this represents a substantial narrowing of $18.8 billion compared to the revised September figure of $48.1 billion. This decline marks a critical pivot point in a year defined by volatile import patterns and aggressive trade policy maneuvers.
Main Facts: A Convergence of Rising Exports and Falling Imports
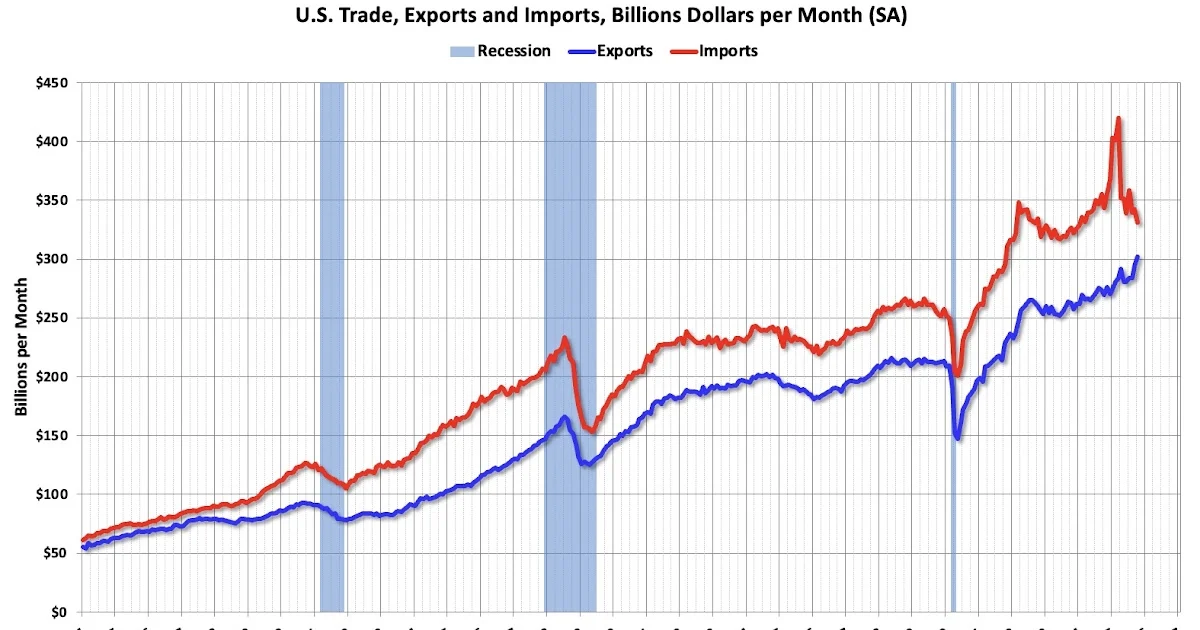
The October trade report provides a compelling snapshot of a narrowing gap between what the United States sells to the world and what it purchases from foreign markets. Total exports reached $302.0 billion, a robust increase of $7.8 billion over the previous month’s figures. Simultaneously, the demand for foreign goods and services ebbed, with imports falling by $11.0 billion to a total of $331.4 billion.
This dual-action movement—higher export volumes coupled with lower import spending—is the primary driver behind the significant reduction in the trade deficit. On a year-over-year basis, the strength of the U.S. export sector is increasingly apparent, with export values climbing 12% compared to the same period in 2025. Conversely, total imports have retreated by 4% year-over-year, suggesting that the frantic "front-loading" of inventories observed earlier in the year has largely subsided.
Chronology of 2026: From Tariff Anticipation to Market Correction
To understand the October numbers, one must examine the timeline of the preceding months. Throughout the first three quarters of 2026, the U.S. import market was characterized by a "rush to beat the clock."
Early 2026: The Tariff Anticipation Surge
As rumors and subsequent official announcements regarding new trade barriers began to circulate in early 2026, importers significantly accelerated their purchasing schedules. Businesses, fearing that incoming tariffs would render foreign goods prohibitively expensive by the end of the year, flooded U.S. ports with inventory. This artificial spike in import demand caused the trade deficit to balloon throughout the spring and summer, creating a misleading picture of domestic consumption.
Mid-2026: The Peak and Stabilization
By the third quarter, storage capacities in major logistics hubs began to hit their limits. The surge in imported goods began to taper off as supply chains adjusted to the new, more expensive cost environment. Market analysts noted that the September data served as a cooling-off period, which ultimately paved the way for the substantial contraction seen in the October report.

October 2026: The Correction
The October data reflects a more "normalized" trade environment. With warehouses adequately stocked and the immediate panic regarding tariff implementation having cooled, the natural market forces of supply and demand began to reassert themselves. The 12% year-over-year growth in exports further suggests that U.S. manufacturers have successfully navigated the initial disruption, finding new markets or benefiting from the competitiveness of their specific sectors.
Supporting Data: Dissecting the Trade Deficit
A deeper look at the trade composition reveals that the energy sector remains a bright spot for the American economy. When analyzing the trade deficit by category, it is essential to distinguish between total figures and those excluding volatile petroleum products.
The Petroleum Factor
The United States has transitioned from being a major net importer of energy to a significant exporter. The data indicates that net exports of petroleum products remain firmly in positive territory and have been on a consistent upward trajectory. When the petroleum deficit (or in this case, surplus) is stripped away, the "ex-petroleum" trade deficit presents a more nuanced view of the underlying manufacturing and service-based trade performance. The red line in the current trade analysis models—representing the trade deficit excluding petroleum—shows a narrowing trend that mirrors the overall improvement in the national balance of trade.
The China Relationship
Perhaps the most striking statistic within the October release is the narrowing of the bilateral trade deficit with China. The deficit fell to $14.9 billion, a massive decrease from the $28.1 billion recorded just one year ago. This reflects a multi-faceted shift:
- Supply Chain Diversification: American firms are increasingly sourcing goods from Southeast Asia, Mexico, and India, reducing their historical reliance on Chinese manufacturing.
- Reduced Consumer Appetite: The cooling of the U.S. housing and retail sectors has dampened demand for high-volume consumer goods traditionally produced in China.
- Strategic Decoupling: Policy-driven initiatives to onshore or "friend-shore" production have begun to manifest in the official ledger, altering the long-standing dependency on Chinese imports.
Official Responses and Economic Interpretations
The federal agencies involved in the reporting—the Census Bureau and the BEA—have remained largely clinical in their delivery, sticking to the raw numbers. However, economic observers and policy experts have been quick to weigh in on the implications of the report.
"The October numbers are a breath of fresh air for those concerned about the sustainability of the trade gap," says Dr. Elena Vance, a senior fellow at the Institute for Economic Policy. "However, we must be careful not to conflate a one-month drop in the deficit with a long-term structural fix. The decline is partially a reflection of the ‘inventory hangover’ from the first half of the year. The real test will be whether the 12% growth in exports can be sustained in the face of a potentially strengthening dollar."
Conversely, proponents of the current administration’s trade policy argue that the data vindicates the use of aggressive trade measures. "We are seeing the transition from a trade environment that favored foreign manufacturing to one that prioritizes domestic production," noted a spokesperson for the Department of Commerce in a statement following the release. "The reduction in our deficit with key partners like China is evidence that our strategy is working."

Implications for the Future: What to Expect in 2027
As the economy moves into the final stages of 2026 and looks toward 2027, the implications of this trade report are manifold.
Inflationary Pressures
While a smaller trade deficit is often viewed as a positive macroeconomic indicator, it is not without risks. A decrease in imports—if driven by trade barriers—can lead to higher consumer prices. As the cost of imported raw materials and finished goods rises, domestic manufacturers are often forced to pass those costs on to consumers, potentially fueling inflation.
Currency Valuation
The trade balance is inextricably linked to the value of the U.S. Dollar. A shrinking deficit typically exerts upward pressure on the dollar, as the demand for foreign currency to pay for imports decreases. A stronger dollar, in turn, makes American exports more expensive for foreign buyers, which could threaten the 12% export growth rate observed in October. Policymakers will be watching the Federal Reserve’s reaction to these currency fluctuations closely.
Global Geopolitical Tensions
The narrowing of the deficit with China is not merely an economic event; it is a geopolitical one. As the U.S. reduces its economic exposure to its largest rival, the potential for trade-related friction remains high. Both sides are currently engaged in a delicate dance of protectionism and market-based negotiation. Investors should anticipate continued volatility in sectors heavily exposed to international supply chains, particularly electronics, automotive components, and heavy machinery.
Domestic Manufacturing Renaissance?
The data provides a glimmer of hope for those who argue that the U.S. can successfully re-industrialize. If the trend of rising exports continues, it could signal that American-made products are finding a more competitive footing in the global marketplace. However, this will require significant capital investment in automation and workforce training to ensure that the U.S. can compete on quality and efficiency rather than just policy-driven pricing advantages.
In conclusion, while the $29.4 billion trade deficit for October is a significant improvement, it is merely one chapter in a much larger, ongoing narrative of global economic realignment. The combination of shifting supply chains, the normalization of import inventories, and the robust performance of U.S. energy exports suggests that the U.S. is navigating a complex transition. Whether this trend toward a lower deficit holds steady or proves to be a temporary fluctuation will depend on the interplay between global consumer demand, central bank policies, and the evolution of international trade agreements in the coming year.