In the rapidly evolving landscape of digital marketing, "engagement rate" remains the North Star for social media professionals. As algorithms prioritize meaningful interactions over passive views, understanding how to accurately measure—and improve—your engagement is no longer optional; it is the cornerstone of a successful content strategy.

Whether you are a social media manager for a global enterprise or a content creator building a personal brand, this comprehensive guide provides the framework you need to move beyond vanity metrics and understand how your audience truly interacts with your content.

What is Engagement Rate?
At its core, engagement rate is a social media metric that quantifies the level of active interaction your audience has with your content. While "reach" tells you how many people saw your post, "engagement" tells you what they actually did with it.
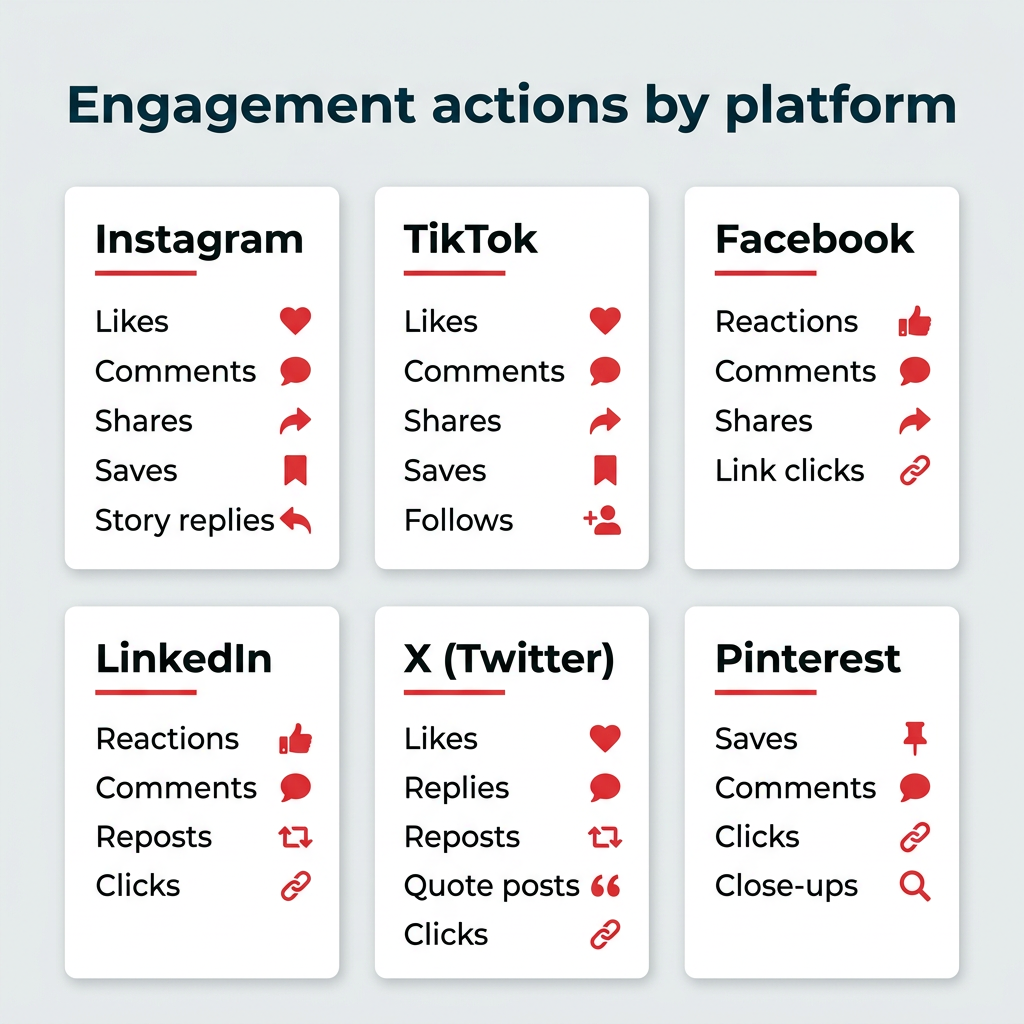
Engagement encompasses a spectrum of actions, including likes, comments, shares, saves, poll responses, and direct messages. Because each platform—from LinkedIn to TikTok—weights these actions differently, calculating an accurate engagement rate requires more than a simple division problem; it requires a strategic understanding of which behaviors provide the most value to your specific business goals.
Why Engagement Rate Matters
Engagement rate serves as the primary indicator of content resonance. When a user stops scrolling to comment or save a post, they are signaling that your content provided value, triggered an emotion, or sparked a thought.
From a technical standpoint, higher engagement rates are the fuel for social algorithms. Platforms like Instagram and TikTok are designed to serve content that keeps users on the app; therefore, the more your audience engages, the more the algorithm will push your content to new, potential followers. Furthermore, for enterprise teams, high engagement is a tangible KPI that can be used to demonstrate return on investment (ROI) to stakeholders, proving that social media efforts are translating into real-world audience behavior.
The Mechanics of Measurement: 6 Essential Formulas
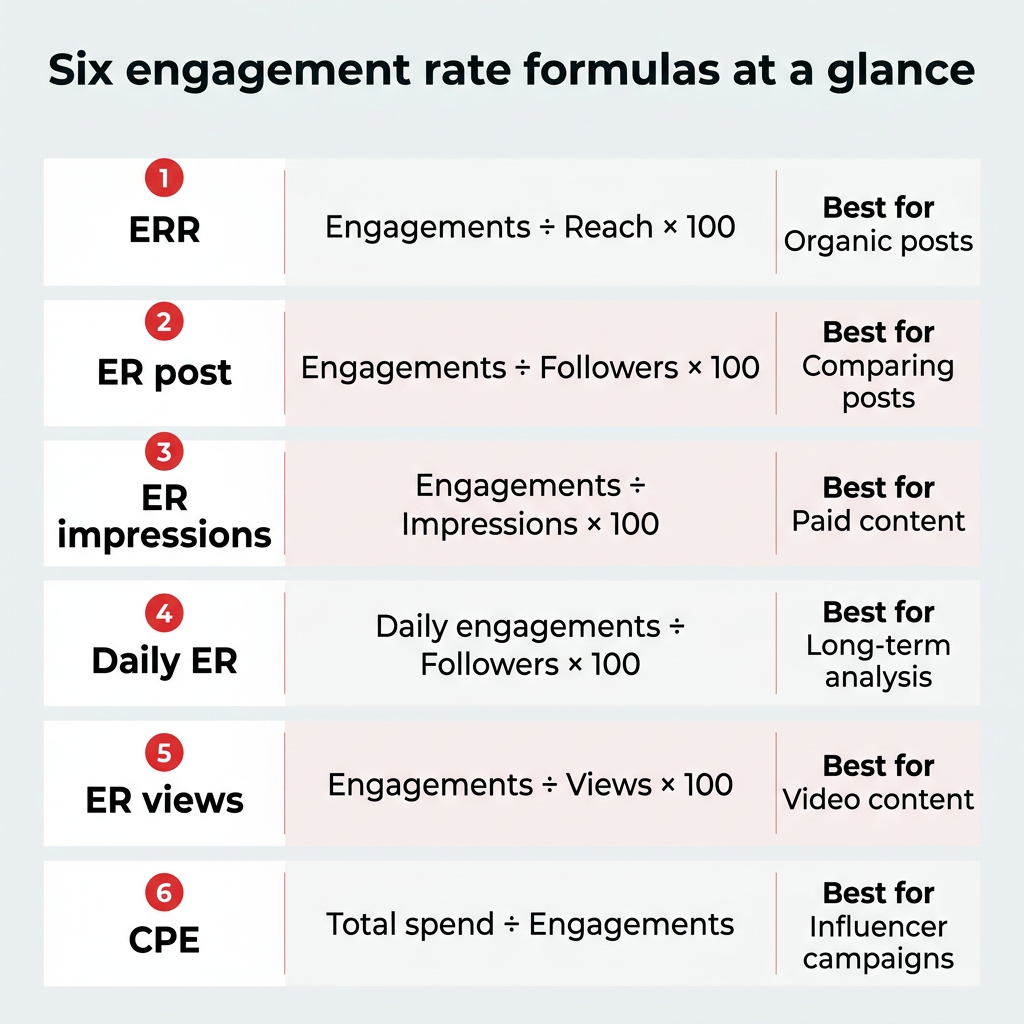
One of the most common pitfalls for marketers is using a "one-size-fits-all" approach to engagement. In reality, there are six primary ways to calculate your rate, each serving a distinct analytical purpose.

1. Engagement Rate by Reach (ERR)
This is the gold standard for organic content. By measuring the percentage of people who interacted with your post after seeing it, you eliminate the noise of passive impressions.
- Formula: (Total Engagements / Reach) * 100
- Best For: Understanding how well your content resonates with the audience it actually reaches.
2. Engagement Rate by Post (ER Post)
This formula compares interactions against your total follower count. It is the metric most frequently used by influencers and brand ambassadors.
- Formula: (Total Engagements / Total Followers) * 100
- Best For: Comparing performance consistency across different posts over time.
3. Engagement Rate by Impressions (ER Impressions)
Since one user can see a post multiple times (creating multiple impressions), this metric is significantly more conservative.
- Formula: (Total Engagements / Total Impressions) * 100
- Best For: Analyzing the efficiency of paid advertising campaigns where CPM (Cost Per Mille) is the primary cost structure.
4. Daily Engagement Rate
This metric looks at how your audience interacts with your account on a daily basis, rather than on a per-post basis.
- Formula: (Total Daily Engagements / Total Followers) * 100
- Best For: Long-term analysis of brand health and community activity.
5. Engagement Rate by Views (ER Views)
Specific to video content, this tracks interaction relative to the number of people who watched the video.
- Formula: (Total Engagements / Total Video Views) * 100
- Best For: Measuring the success of Reels, TikToks, and YouTube Shorts.
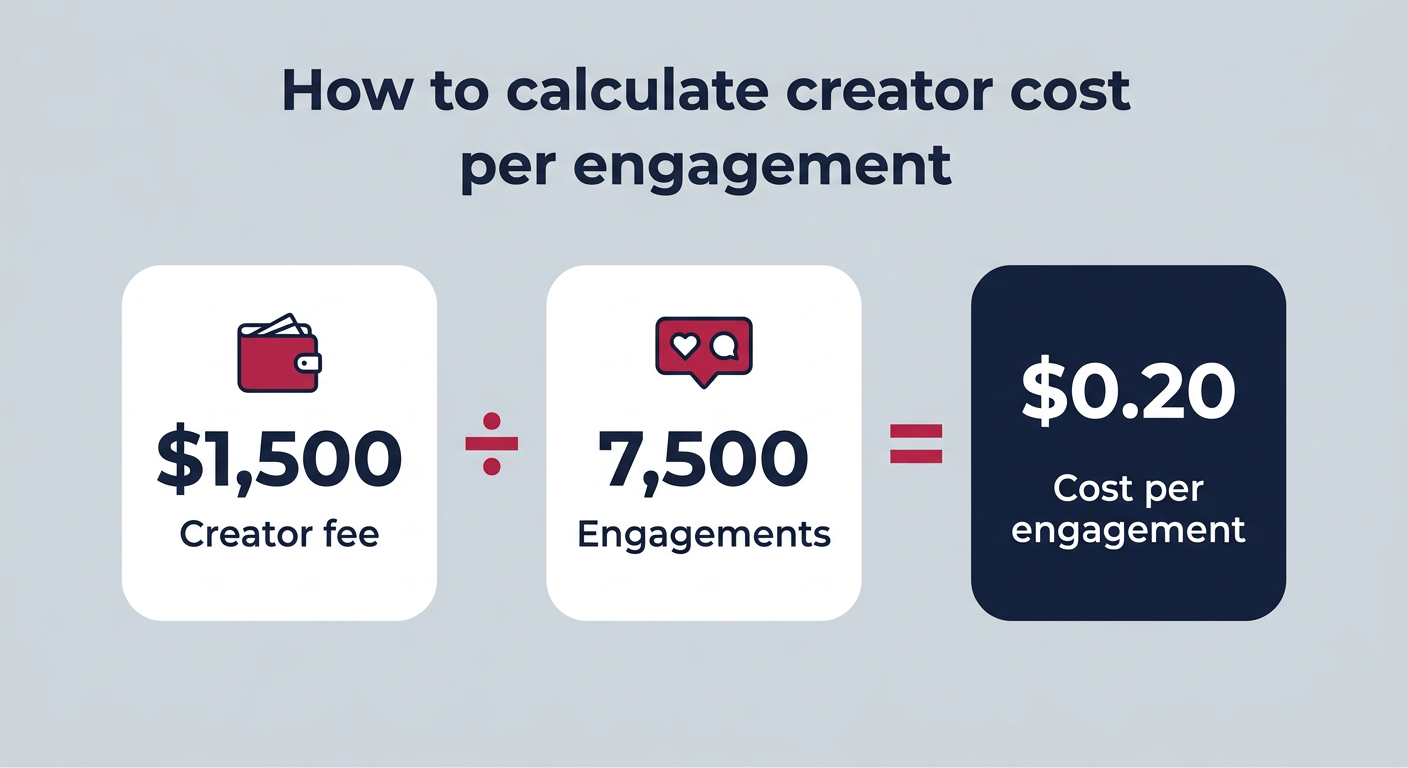
6. Cost Per Engagement (CPE)
This is a financial metric used to evaluate the fiscal efficiency of content.
- Formula: Total Amount Spent / Total Engagements
- Best For: Influencer marketing partnerships and paid social campaigns.
Platform-Specific Nuances
While the math remains consistent, the data inputs vary by platform.
- Instagram: For Feed posts, focus on ERR. For Reels, switch to ER Views. Remember that Stories should be measured independently, focusing on replies and sticker taps.
- TikTok: As a video-first platform, ER Views is the standard. Note that native TikTok analytics may not always count saves or follows in their dashboard, so manual tracking may be necessary for precision.
- YouTube: YouTube Studio does not provide an "engagement rate" column. You must manually aggregate likes, comments, and shares, and divide them by total video views to get an accurate read.
What is a "Good" Engagement Rate? 2026 Benchmarks
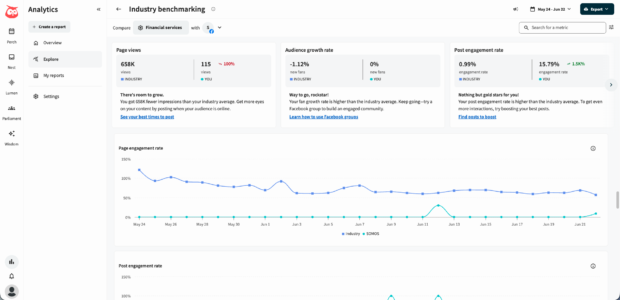
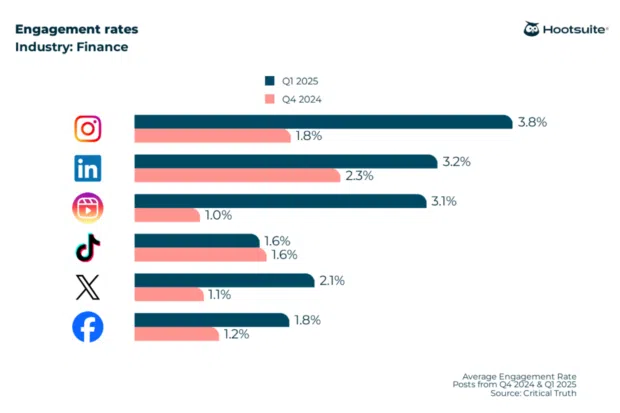
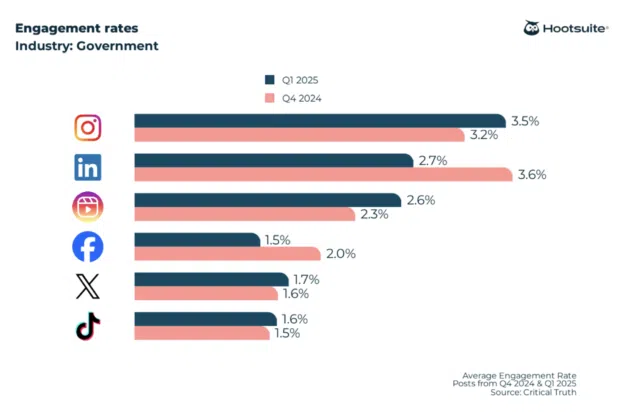
A "good" engagement rate generally sits between 1% and 5%. However, context is everything. A 1% rate might be stellar for a highly regulated financial services firm, while a 1% rate might be underwhelming for a lifestyle brand.
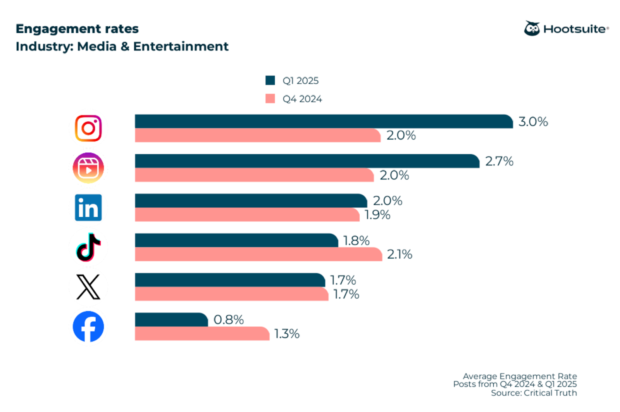
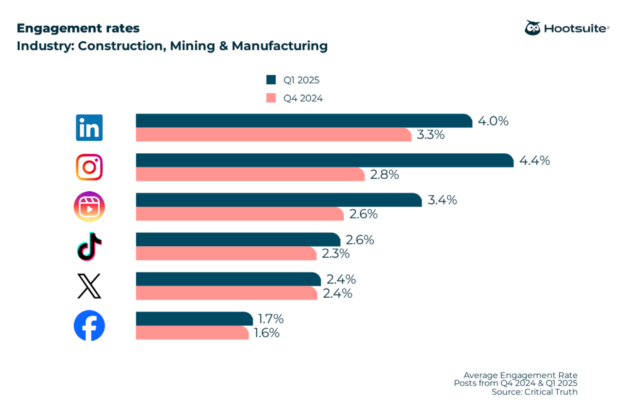
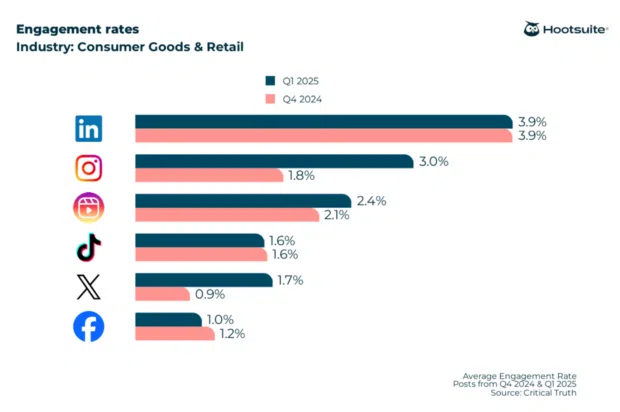
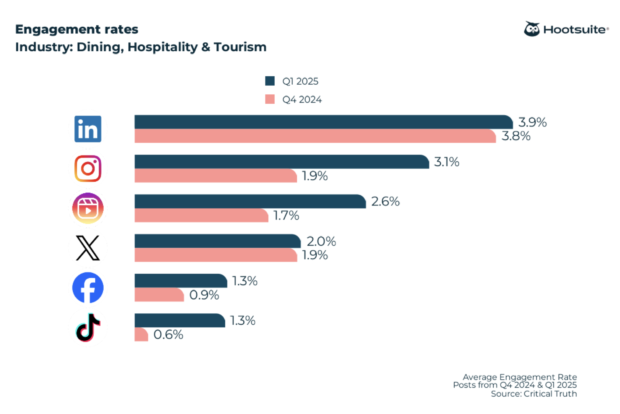
Industry Performance Snapshots
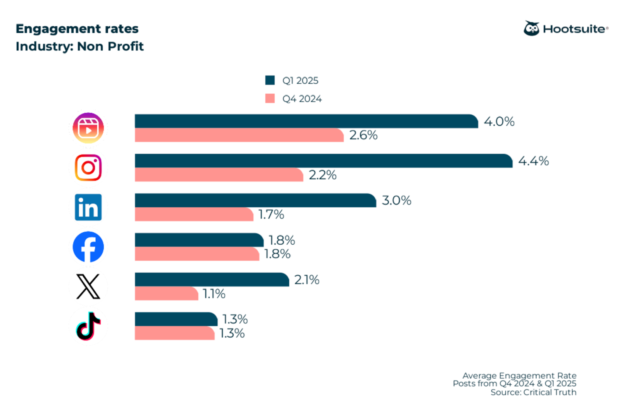
Based on 2026 data, here is how industries currently perform across the most popular platforms:
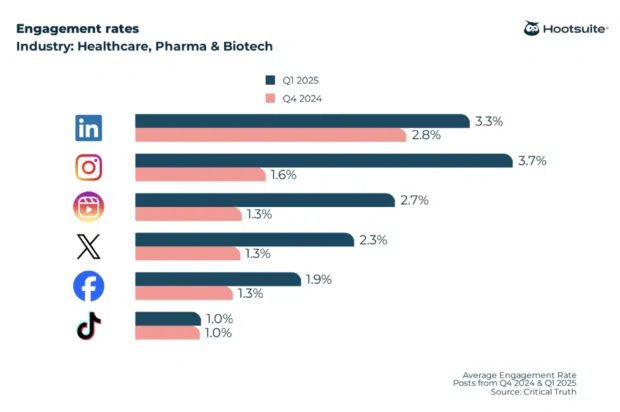
- Nonprofits: Often lead the pack on Instagram, hitting up to 5.5% engagement due to the mission-driven, highly shareable nature of their content.
- Retail & Consumer Goods: High-volume posting schedules tend to suppress average rates, though LinkedIn often sees higher interaction (around 4.3%) due to employee advocacy.
- Healthcare & Pharma: These sectors face the toughest challenges on platforms like TikTok (often seeing rates as low as 1%) due to strict regulatory and privacy constraints that limit "viral" content.
- Financial Services: Surprisingly robust, with Instagram benchmarks hovering around 4.1%. The "less is more" approach—fewer, highly curated posts—seems to drive better per-post engagement.
Common Mistakes and How to Avoid Them
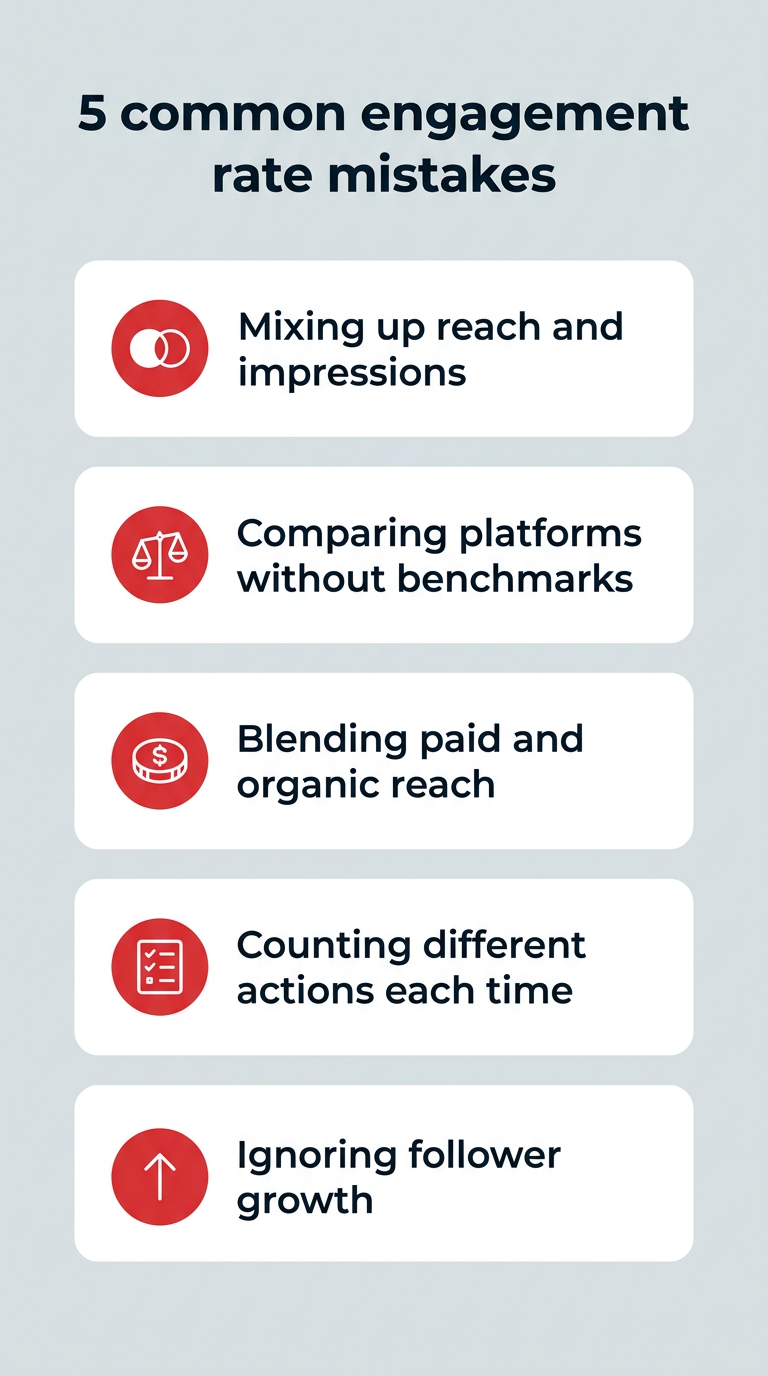
Consistency is the most vital element of social media reporting. Many marketers fail because they change their definitions mid-year. Avoid these five common errors:
- Inconsistent Definitions: Ensure that "Total Engagements" includes the same actions every month (e.g., if you count shares in January, don’t exclude them in February).
- Mixing Platforms: Never compare an Instagram engagement rate to a LinkedIn rate. Compare against platform-specific benchmarks.
- Ignoring Paid vs. Organic: Always segment your data. Paid posts will naturally have different reach-to-engagement ratios than organic ones.
- Over-reliance on Follower Counts: As your follower count grows, your average ER by post will naturally dip. This is normal; do not mistake growth for failure.
- Focusing on Volume, Not Value: High engagement on a low-quality post is less valuable than moderate engagement on a post that drives traffic to your website or leads to a conversion.
Practical Tactics to Improve Engagement
If your numbers are falling short, focus on the "Triple Threat" of engagement optimization:
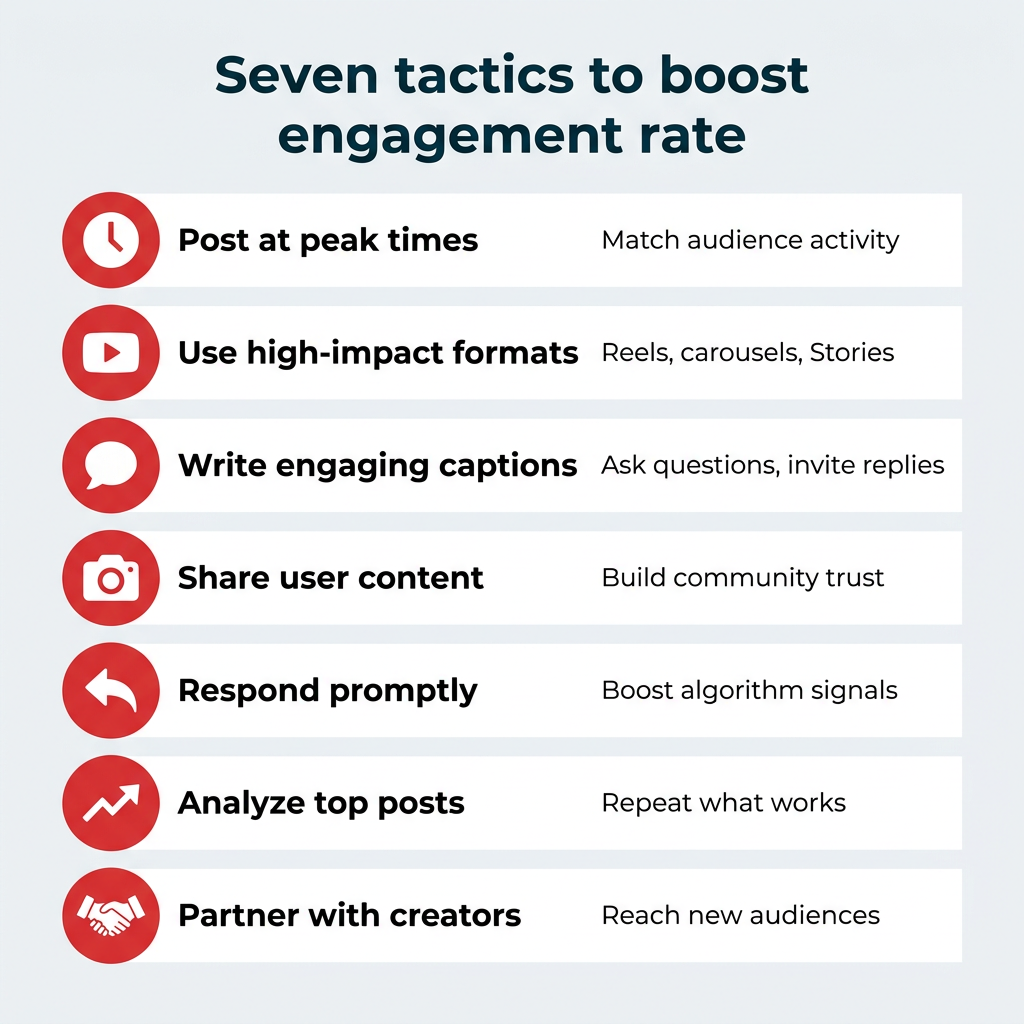
- Content Format: Shift your mix toward what the algorithms currently prioritize. In 2026, this means leaning heavily into short-form video (Reels/TikToks) and high-value carousels.
- The "First Hour" Rule: The velocity of engagement matters. Try to post when your specific audience is most active to trigger the algorithm early.
- Community Management: Social media is a two-way street. Don’t just broadcast; respond to comments, ask questions in your captions, and use interactive features like polls and stickers to lower the barrier for user participation.
Implications for Future Strategy
Engagement rate data should be the engine of your content planning. If your data shows that video content consistently earns a 3.9% engagement rate while image posts struggle at 1.2%, your strategy for the next quarter is clear: pivot your resources toward video.
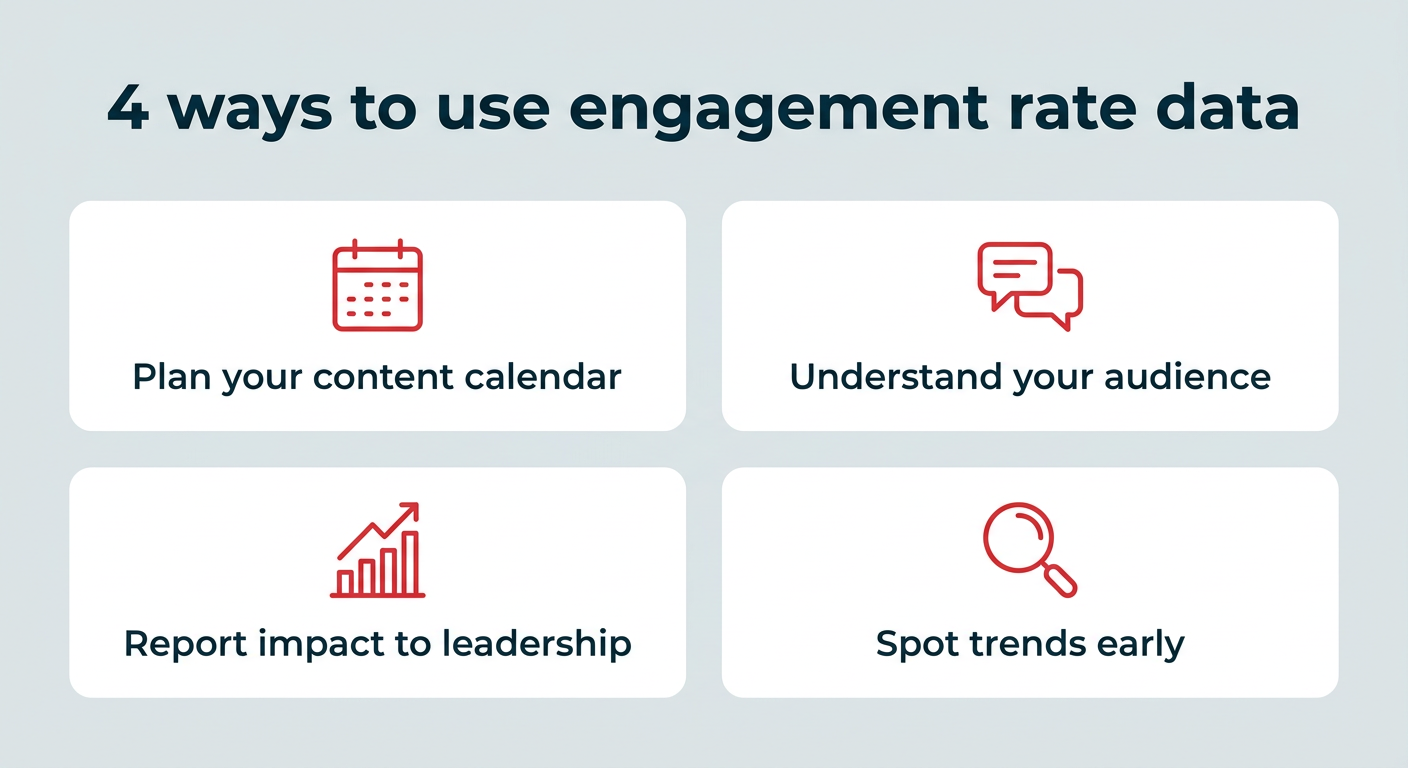
Ultimately, engagement rate is not just a number for your monthly report. It is a diagnostic tool that reveals the health of your brand’s relationship with its community. By standardizing your formulas, benchmarking against your specific industry, and consistently iterating based on the data, you can transform your social media presence from a simple broadcasting channel into a high-performing engine of brand loyalty and business growth.

For enterprise-level organizations, consider utilizing automated analytics tools—such as Hootsuite’s Perch—to remove the manual burden of spreadsheet management, allowing your team to focus on the creative strategy that drives these numbers higher.