As the environmental consequences of global warming become increasingly tangible—manifesting in extreme weather patterns, rising sea levels, and ecological volatility—policymakers worldwide are under immense pressure to pivot away from carbon-intensive economies. The challenge is twofold: limiting greenhouse gas (GHG) emissions to slow the pace of climate change while simultaneously building resilient infrastructure to mitigate existing risks. This dual mandate has moved to the center stage of both international diplomacy and domestic legislative agendas.
The Global Context: Glasgow and the Call to Action
In November of last year, the eyes of the world turned to Glasgow, Scotland, for the United Nations Climate Change Conference, widely known as COP26. The summit served as a critical juncture for world leaders to reconcile the urgent scientific consensus with the slow pace of political progress.
The conference resulted in a series of ambitious, albeit contentious, pledges. Among the most significant outcomes was the formal agreement to "phase down" the use of coal—the most carbon-intensive fossil fuel—and to address the broader reliance on hydrocarbons for global energy needs. While the pledges marked a shift in rhetoric, the actualization of these goals remains the true test for the participating nations. For the United States, which remains one of the world’s largest contributors to atmospheric carbon, the Glasgow outcomes reinforced a growing internal consensus that environmental policy is no longer a peripheral concern, but a cornerstone of national security and economic strategy.
Domestic Policy: The Biden Administration’s Green Pivot
The first year of President Joe Biden’s administration was defined by a determined, if sometimes politically difficult, effort to integrate climate goals into the U.S. economic framework. The cornerstone of this effort was the $1 trillion Bipartisan Infrastructure Law, signed into law in November.
This legislation represents one of the most significant federal investments in climate-conscious infrastructure in decades. Beyond traditional road and bridge repairs, the bill allocates billions toward:
- The Electric Grid: Modernizing the transmission system to handle renewable energy integration.
- Clean Energy: Funding for research, development, and deployment of carbon-capture technologies and advanced battery storage.
- Transportation: Massive capital injections into electric vehicle (EV) charging networks and the expansion of high-efficiency rail and public transit systems, designed to decouple economic growth from carbon output.
Beyond the legislative sphere, the administration has utilized executive authority to enforce change. President Biden set a bold 2030 target to slash U.S. greenhouse gas emissions, aiming for a significant reduction from 2005 levels. Furthermore, a sweeping executive order mandates that the federal government—the nation’s largest energy consumer—transition its own operations to carbon neutrality. By leveraging federal procurement power, the administration hopes to create a market "pull" that incentivizes private-sector innovation in green technology.
The Magnitude of the U.S. Carbon Footprint
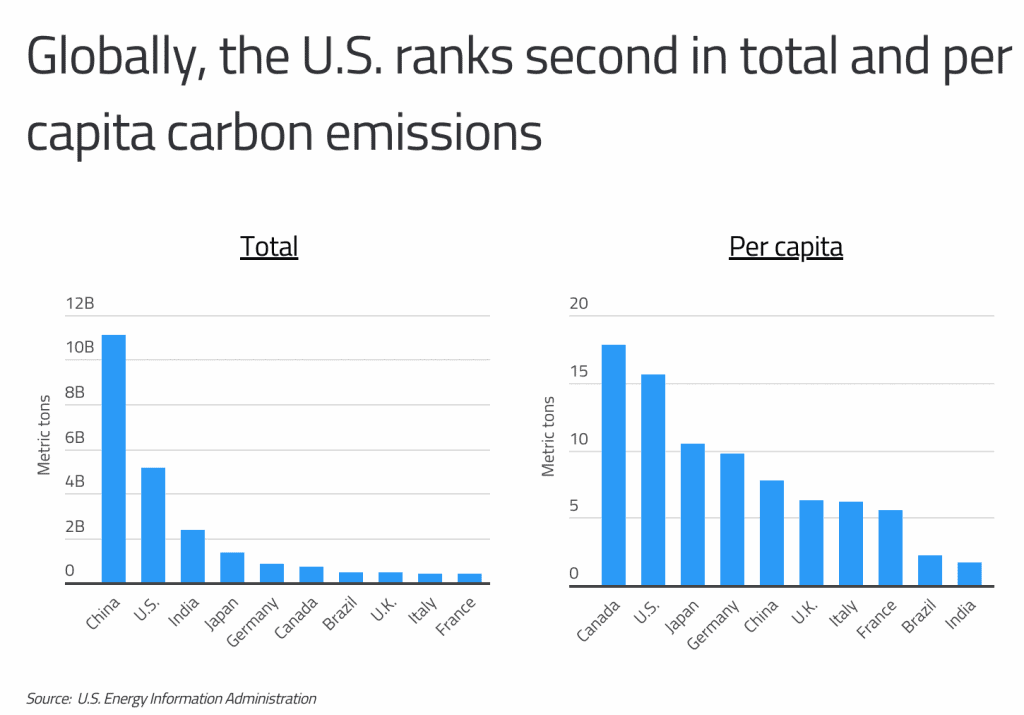
The necessity of these actions is underscored by the scale of the American carbon output. As the world’s largest economy, the United States occupies a pivotal role in the global emissions ledger. Currently, the U.S. generates approximately 5.1 billion tons of CO2 annually. While this is second only to China—which produces roughly 11.1 billion tons—the U.S. remains an outlier in terms of per capita consumption.
With per capita emissions of 15.6 tons of CO2, the average American’s carbon footprint remains significantly higher than the global average and even surpasses that of many other industrialized nations, trailing only Canada, which stands at 17.8 tons per capita. These figures highlight the structural reliance of the U.S. economy on high-energy consumption, a reality that policymakers are now attempting to reshape.
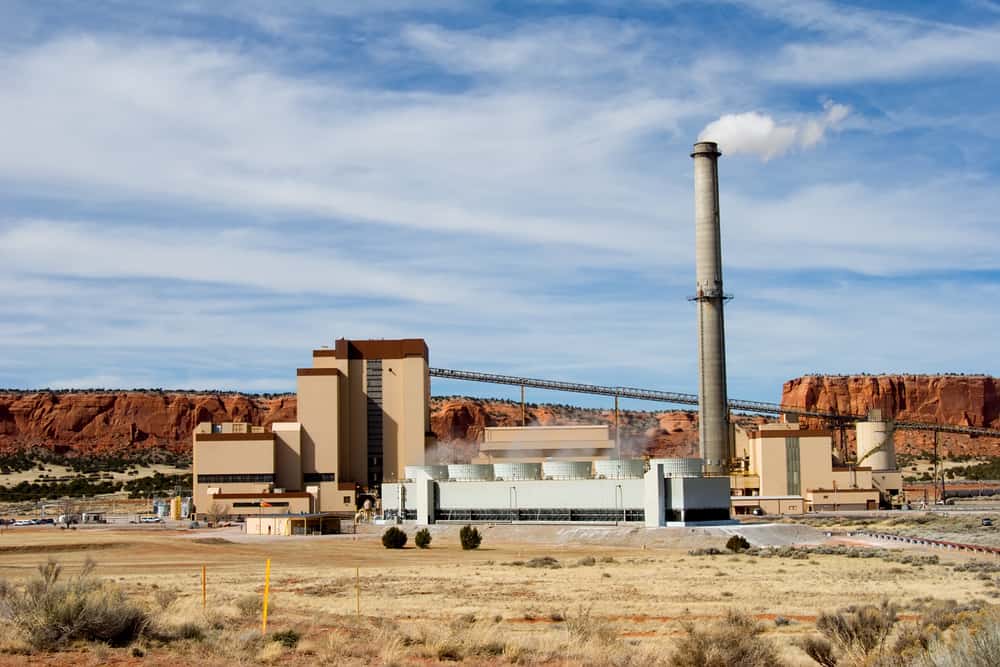
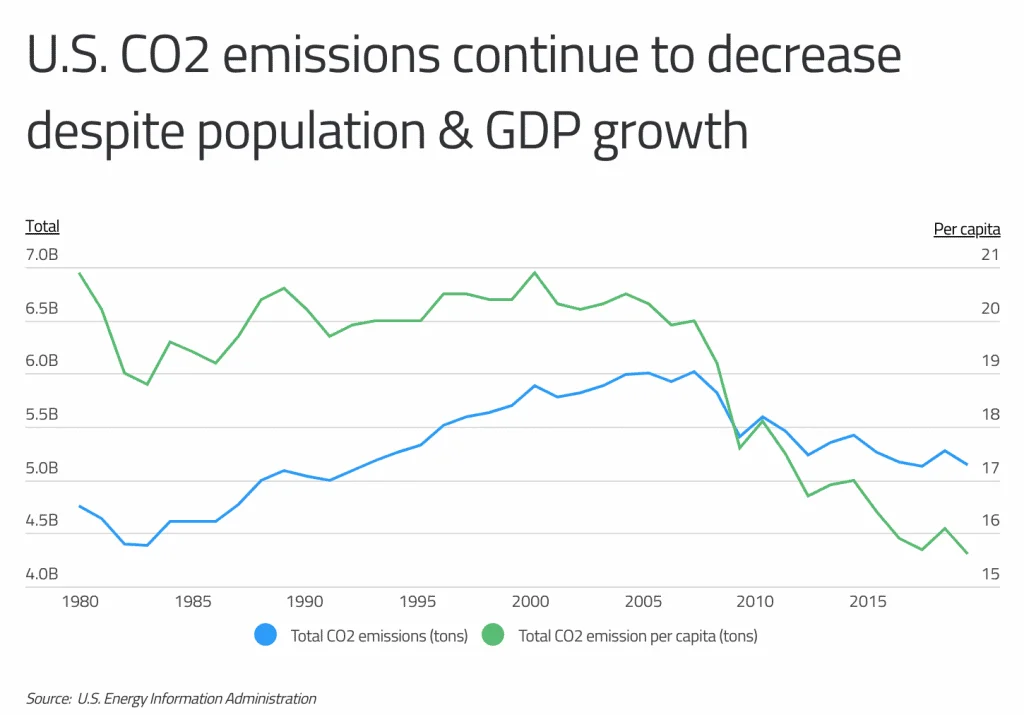
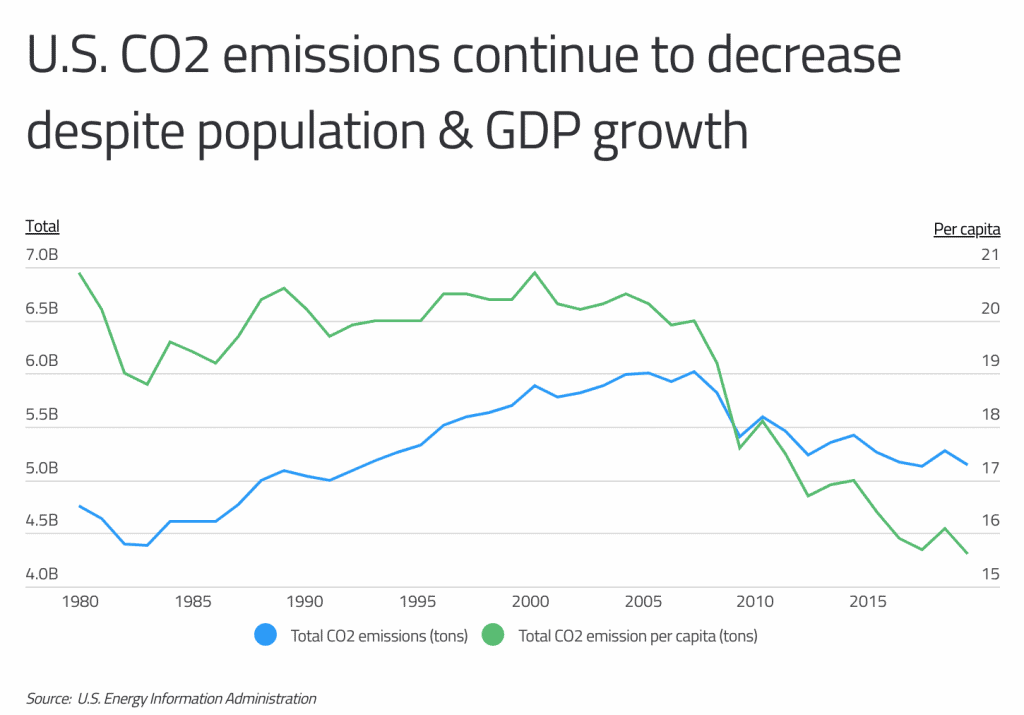
However, the trend lines offer a glimmer of optimism. Since peaking at approximately 6 billion tons in 2007, total U.S. CO2 emissions have declined by nearly 1 billion tons. Crucially, this reduction has occurred alongside consistent growth in both the national population and the Gross Domestic Product (GDP). This "decoupling"—the ability to grow an economy while reducing its carbon intensity—suggests that the transition to a lower-carbon future is not only possible but already underway.
State-Level Disparities: A Regional Breakdown
The national average masks profound differences at the state level. Emissions are not distributed evenly across the map; they are the product of specific economic compositions, geographic reliance on fossil fuels, and individual state-level environmental mandates.
The Heavy Hitters: Economic Drivers of Emissions
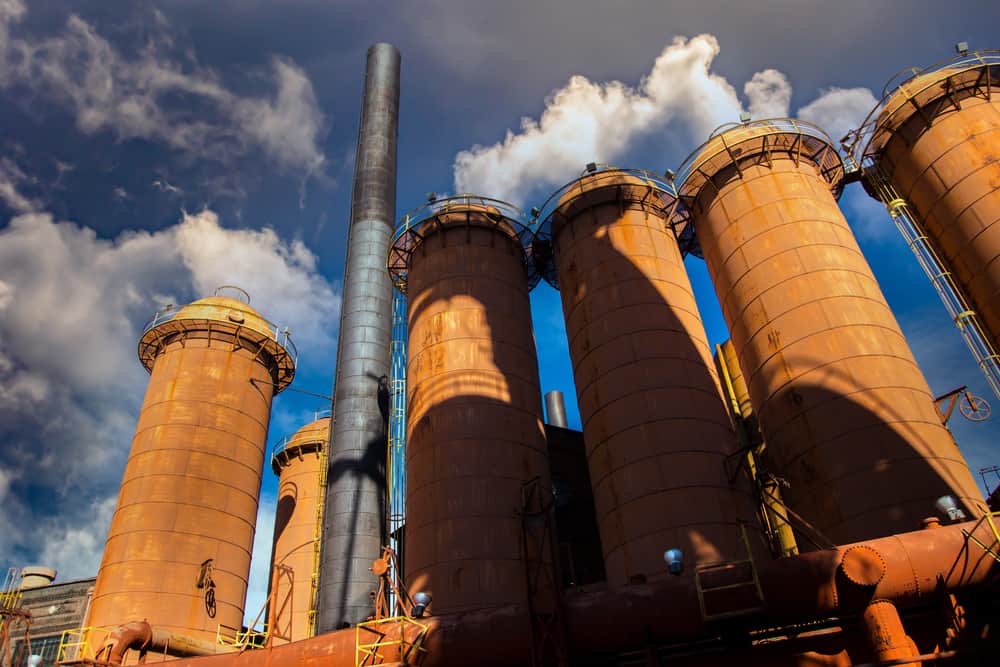
Larger states like Texas and California often top the lists for total annual emissions due to their massive populations and industrial outputs. However, when viewed through the lens of per capita emissions, the picture changes. States with smaller populations but heavy reliance on extractive industries—such as mining, drilling, and coal-fired power generation—frequently record the highest per-person carbon footprints.
The 15 States with the Highest Per Capita Emissions
Based on data from the U.S. Energy Information Administration (EIA) and the U.S. Census Bureau, the states with the highest per capita CO2 emissions are characterized by their industrial reliance on hydrocarbons:
- Wyoming: At the top of the list, Wyoming remains heavily dependent on coal. Nearly 80% of the state’s electricity is generated from coal, amounting to over 33 million MWh annually.
- North Dakota: Heavily driven by the oil and gas sector, North Dakota’s industrial activity significantly inflates its per capita footprint.
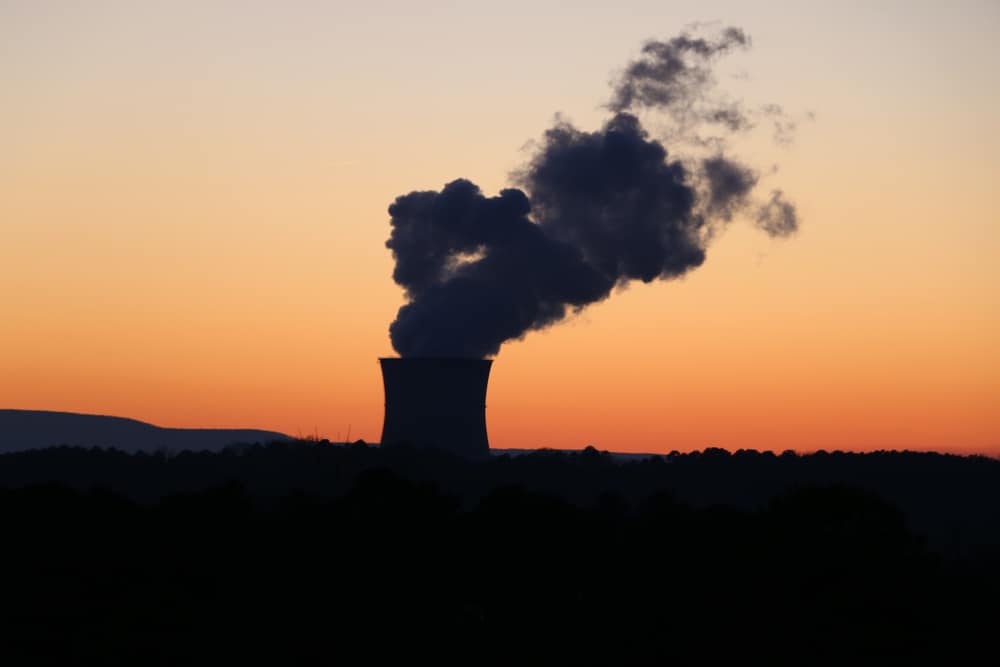
- West Virginia: A long-standing hub for coal extraction and energy production, the state’s economy remains tethered to fossil fuels.
- Alaska: Energy-intensive heating requirements and the reliance on oil production keep Alaska’s per capita emissions among the nation’s highest.
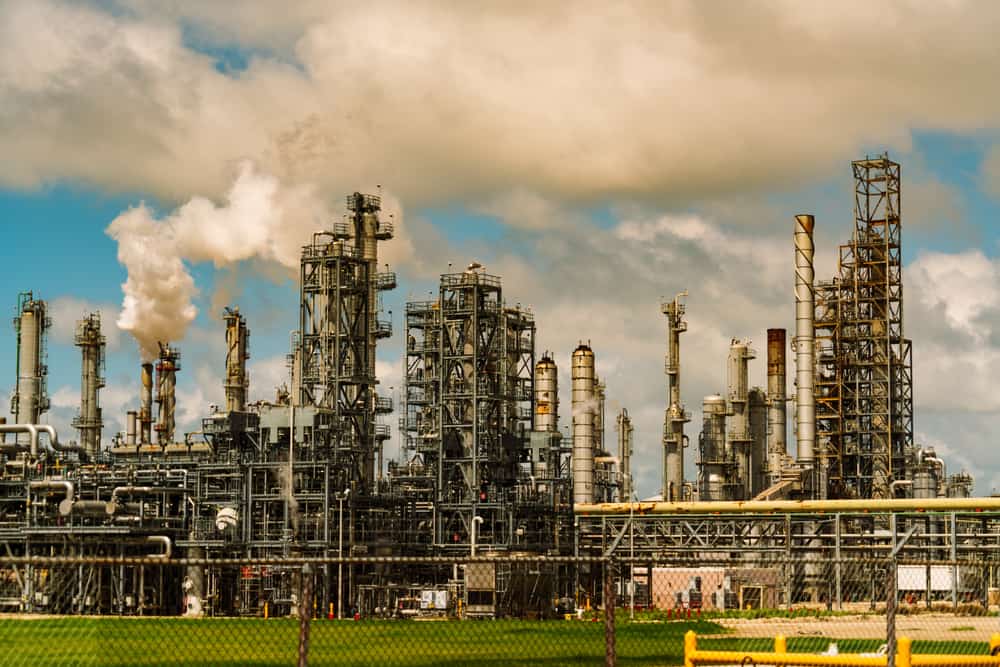
- Louisiana: The state’s extensive petrochemical and refinery sector is a major driver of its carbon output.
- Montana
- Indiana
- Nebraska
- Kentucky
- Iowa
- Oklahoma
- Texas
- Arkansas
- Alabama
- New Mexico
The high ranking of states like Wyoming and West Virginia illustrates the "energy transition gap." While coastal states with service-oriented economies can more easily transition to renewable energy, the states that have historically powered the nation through coal and oil face steeper economic and infrastructural hurdles to decarbonization.
Official Responses and Strategic Implications
The data presents a clear challenge for the federal government: how to support the transition in "energy states" without causing economic collapse in regions where fossil fuel industries provide the majority of jobs and tax revenue.
The Department of Energy (DOE) has signaled that the future of federal support lies in "Just Transition" programs. These initiatives aim to provide workforce retraining for workers in coal and oil industries, shifting them toward careers in wind energy, carbon capture, and grid modernization. The argument from Washington is that the energy transition should be viewed as an industrial policy opportunity—a chance to re-industrialize the American heartland with the technologies of the 21st century.
Future Outlook: Challenges and Opportunities
As the U.S. looks toward its 2030 targets, the interplay between state-level policy and federal oversight will be the primary determinant of success. Several key factors will influence the trajectory:
- Grid Modernization: The ability to move renewable energy from where it is generated (e.g., wind in the Great Plains) to where it is needed (e.g., coastal urban centers) requires a national transmission strategy that has historically been stymied by local regulation.
- Technological Scalability: For states like Wyoming, the path forward may rely heavily on Carbon Capture, Utilization, and Storage (CCUS). By stripping carbon from industrial exhaust before it enters the atmosphere, these states may be able to maintain their industrial base while adhering to stricter federal emissions guidelines.
- Public Perception: The political feasibility of climate action hinges on the economic impact. If the energy transition is perceived as a threat to local livelihoods, resistance will intensify. Conversely, if it is framed as a path to high-paying union jobs in manufacturing and installation, political support may broaden.
Conclusion
The reduction of the U.S. carbon footprint is no longer a theoretical debate; it is a measurable, ongoing process that is being etched into the nation’s infrastructure. While the country remains one of the world’s most significant emitters, the sustained decline in emissions since 2007 proves that structural change is possible.
The path forward requires a delicate balancing act. Policymakers must reconcile the urgency of the global climate crisis with the reality of regional economic dependence on fossil fuels. By investing in the electric grid, incentivizing innovation, and supporting the workforce in transition-heavy states, the United States has the potential to maintain its position as a global leader—not just in economic output, but in the creation of a sustainable, low-carbon future.
Methodology Note: The data for this analysis was sourced from the U.S. Energy Information Administration (EIA) Environment Dataset and the U.S. Census Bureau’s American Community Survey. Rankings are based on per capita annual CO2 emissions (2018 data), with total annual CO2 emissions used as a tie-breaker.