In the rapidly evolving digital landscape of 2026, data-driven decision-making remains the cornerstone of successful social media strategy. For marketers and creators operating on X (formerly Twitter), understanding the nuances of platform performance is no longer optional—it is a competitive necessity. As X continues to refine its ecosystem, the tools and methodologies for tracking engagement have shifted, moving from a universally accessible dashboard to a tiered system that prioritizes Premium subscribers.

This guide explores the current state of X analytics, how to navigate the paywall, and the specific metrics that separate high-performing brands from the noise.

The Evolution of X Analytics: A Chronology of Access
For over a decade, Twitter provided a robust, free analytics dashboard to every user. This democratization of data allowed small businesses and global enterprises alike to track reach, engagement, and follower growth with ease.
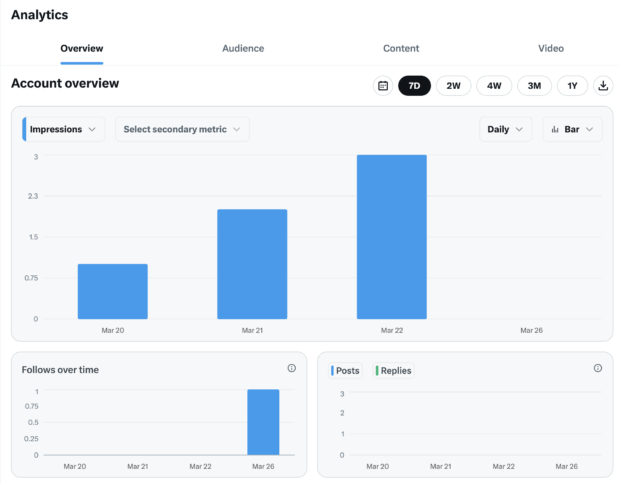
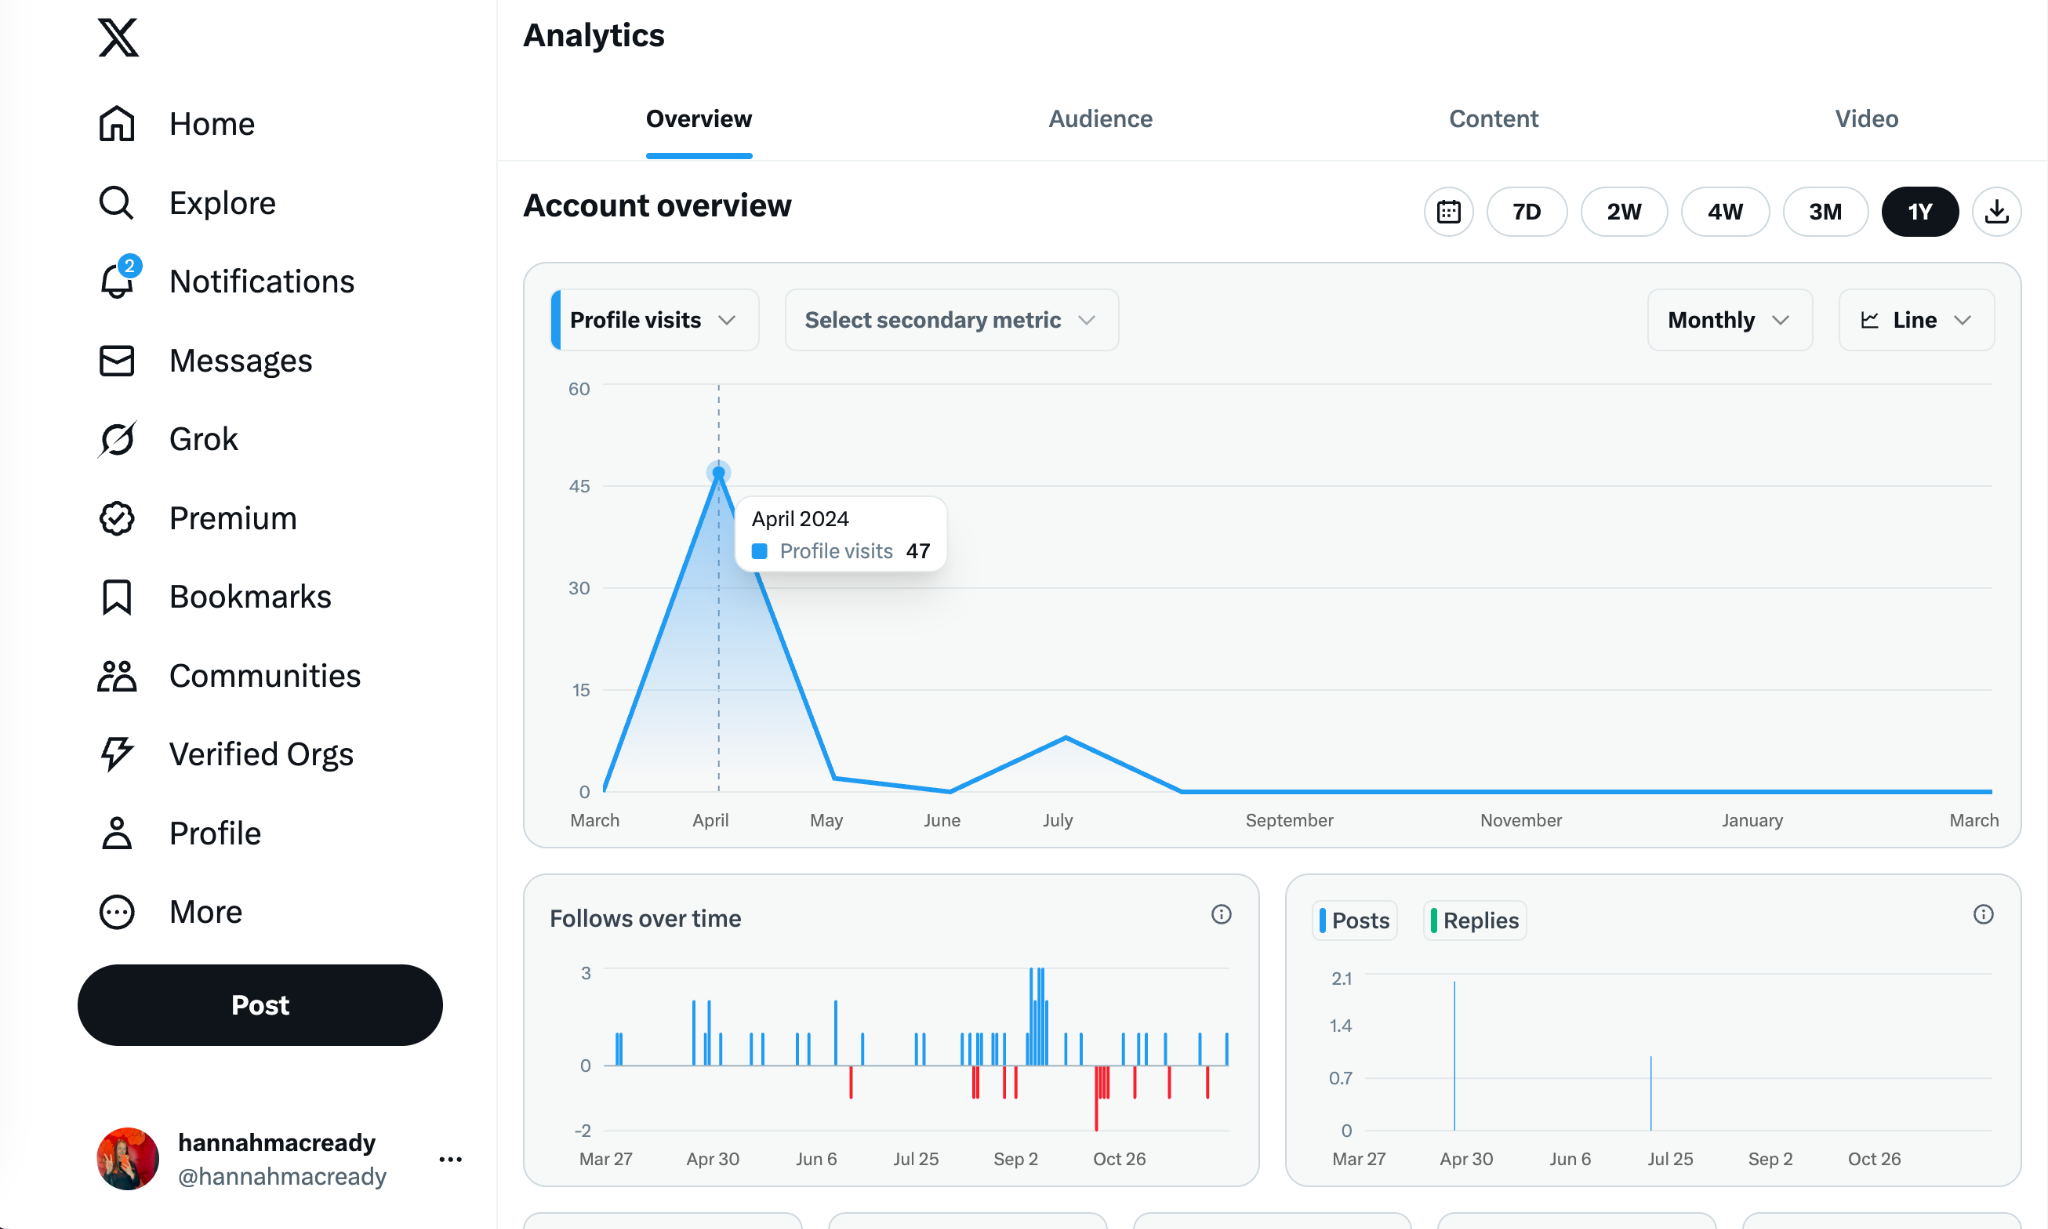
However, following the platform’s transition to X, the company implemented significant structural changes. As of early 2026, the comprehensive, account-wide analytics dashboard has been restricted to X Premium subscribers and verified accounts operating on desktop. This shift impacts approximately 4.4 million paid subscribers who currently leverage these advanced tools to refine their content strategies.
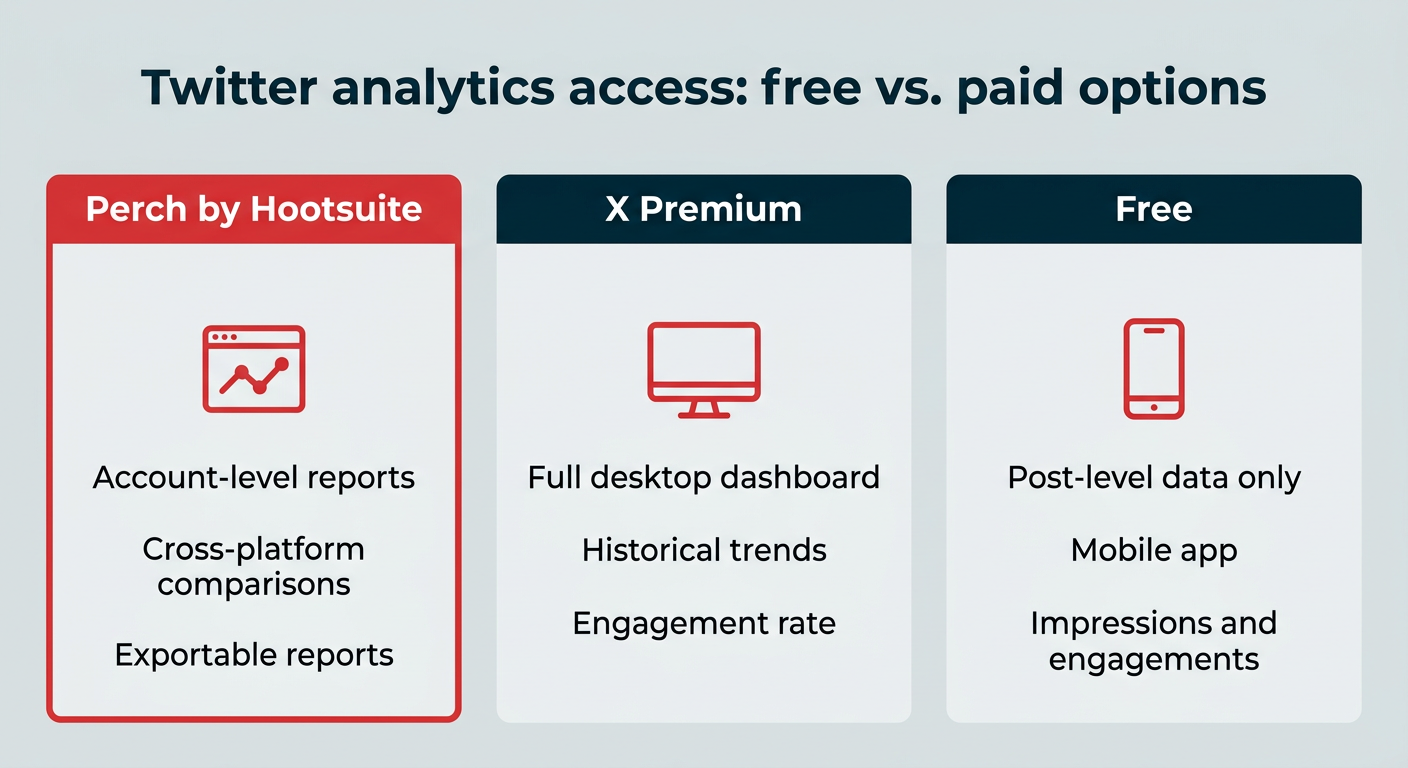
Despite these limitations, X has maintained a "backdoor" for free users: the ability to view granular, post-level analytics directly within the mobile application. This bifurcation of access—full-featured reporting for paid users and limited, post-by-post data for free accounts—defines the current analytics landscape.
Supporting Data: Why Metrics Matter
The necessity of tracking data on X is underscored by shifting user behavior. Recent statistics indicate that average impressions per post saw a 5% year-over-year decline in 2025. This downward trend, combined with algorithmic changes, means that brands can no longer rely on organic reach alone.
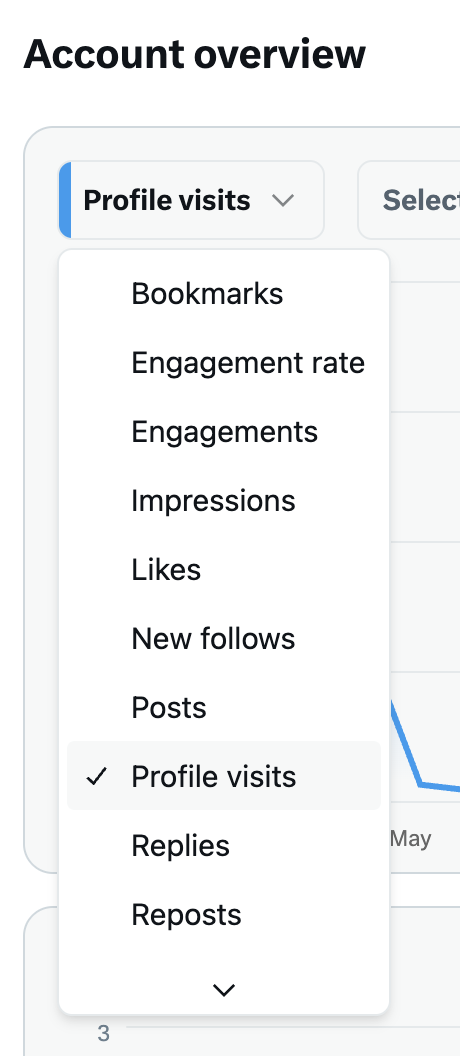
Tracking metrics like Engagement Rate (the ratio of interactions to impressions) and Link Clicks is vital for understanding ROI. Without these insights, marketers are essentially "posting into the void," unable to discern which topics resonate with their audience or which calls-to-action drive meaningful conversions.

How to Access Your Data: Three Proven Methods
Depending on your subscription status and reporting needs, there are three primary ways to track your performance on the platform.

1. The Native X Dashboard (Premium Requirement)
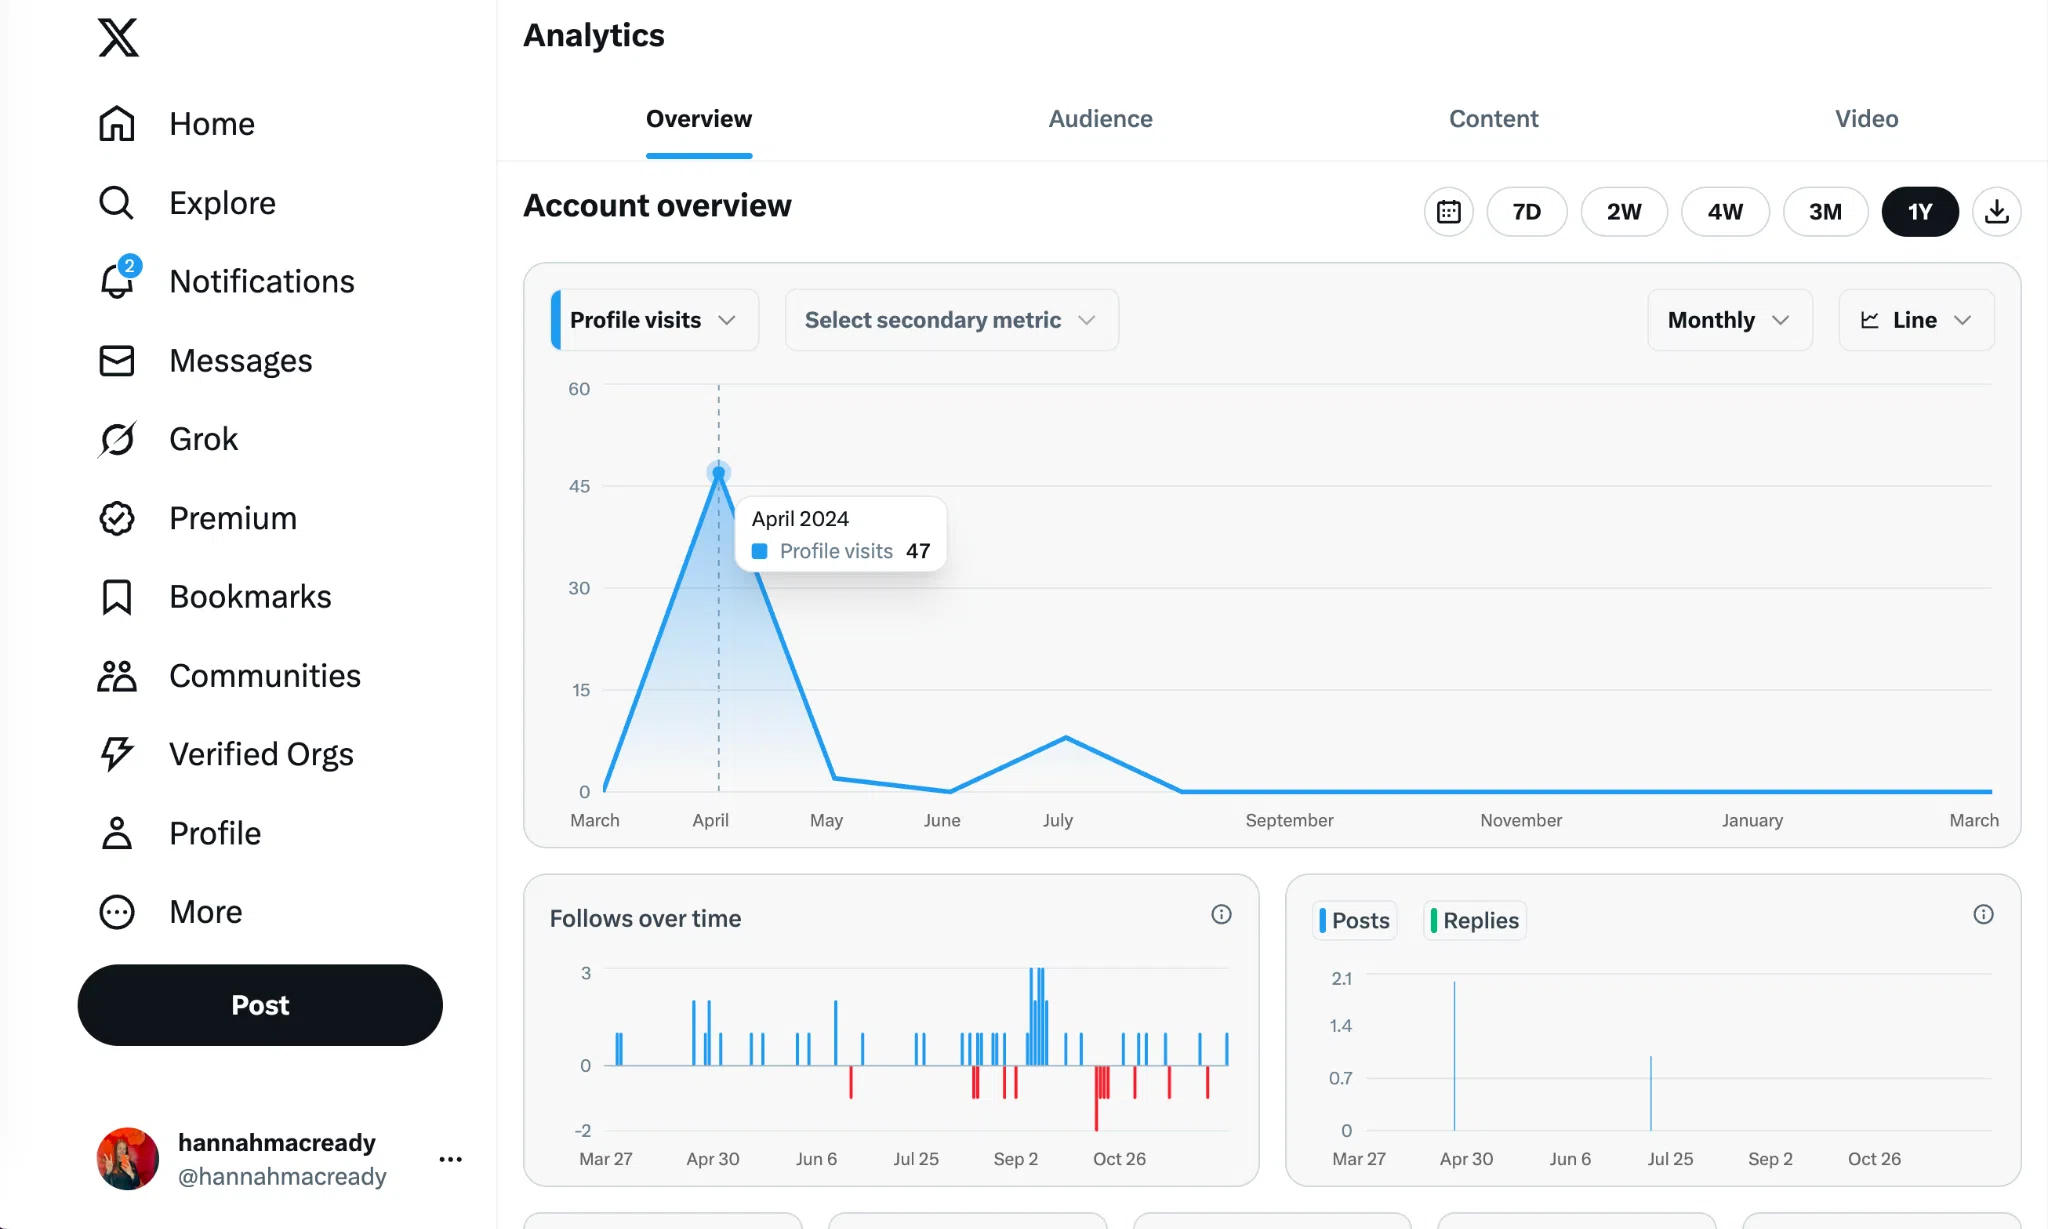
For power users and businesses, the native dashboard remains the gold standard for high-level oversight.
- Access: Navigate to
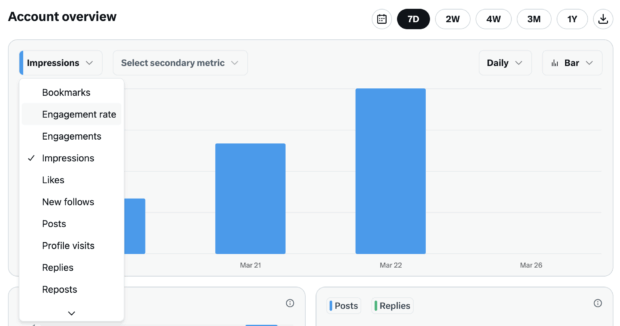
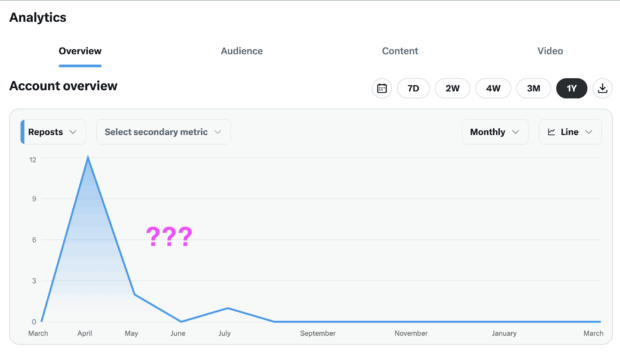
x.com/i/account_analyticsvia desktop. - Functionality: This interface provides a holistic view of your performance, including long-term growth trends, monthly impression totals, and audience demographic shifts. It allows users to export data for deeper analysis in spreadsheets.
2. The Mobile "Hack" (Free Access)
For those who do not hold a Premium subscription, the mobile app remains the primary source of truth.
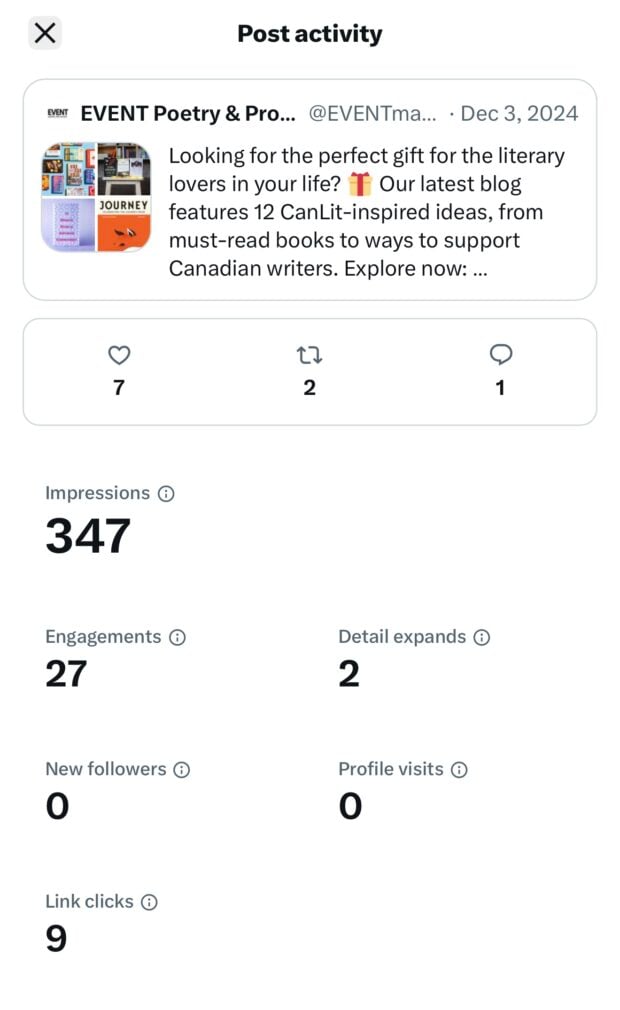
- The Process: By tapping any individual post and selecting the "View Analytics" option from the three-dot menu, users can see real-time engagement data for that specific post. While this method does not provide a macro view of account growth, it is sufficient for testing the performance of specific hooks or creative assets.
3. Third-Party Solutions (e.g., Perch by Hootsuite)
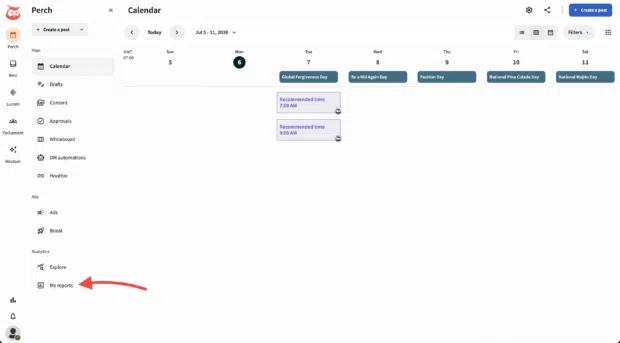
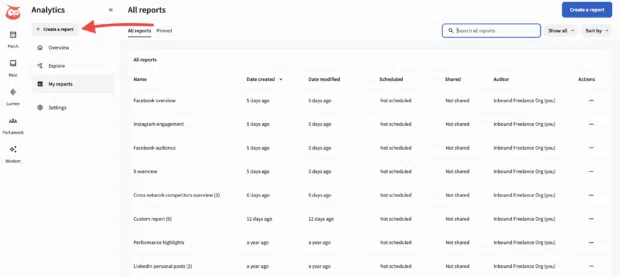
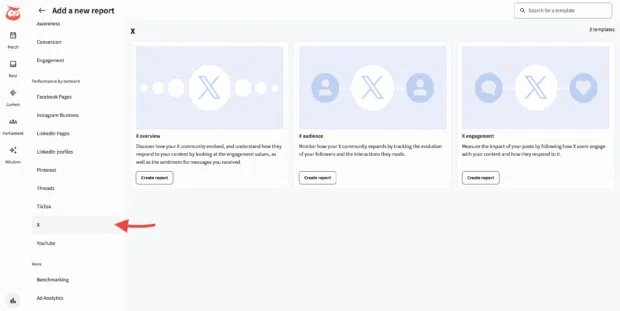
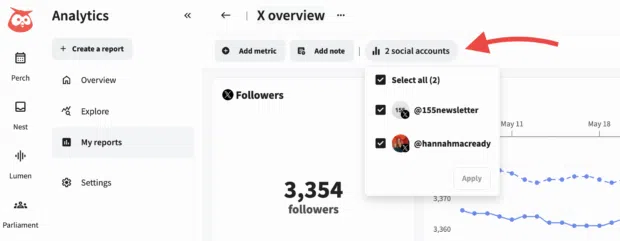
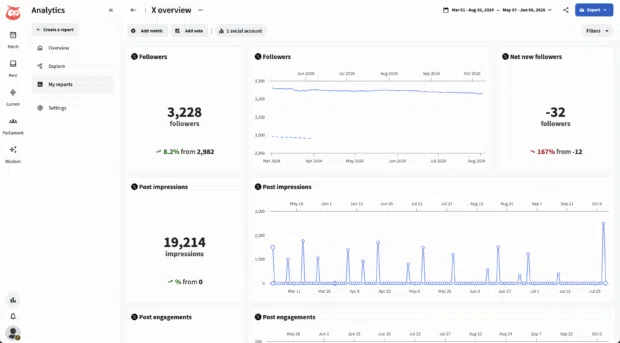
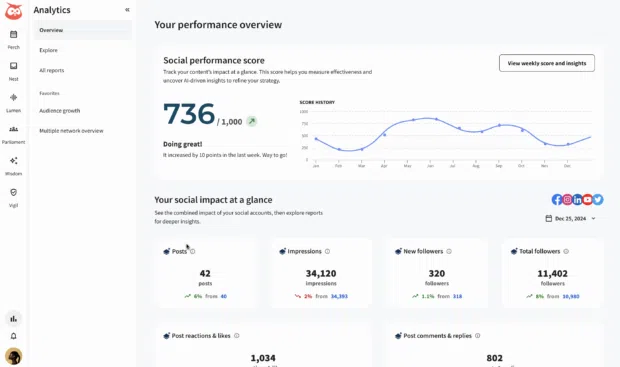
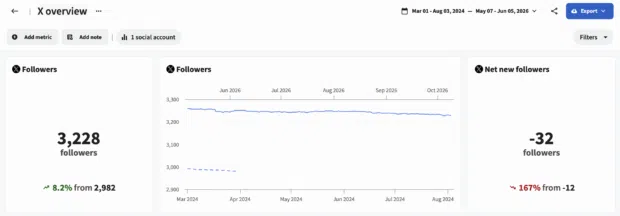
For organizations managing multiple social channels, relying solely on native tools is often inefficient. Third-party platforms, such as Perch, centralize data across all social networks. These tools allow for cross-platform benchmarking, automated reporting, and the ability to track metrics that X’s native dashboard hides, such as unique reach.
Key Performance Indicators: What to Track and Why
Not every number in your analytics dashboard deserves equal attention. To refine your strategy, focus on these critical metrics:
Engagement Rate
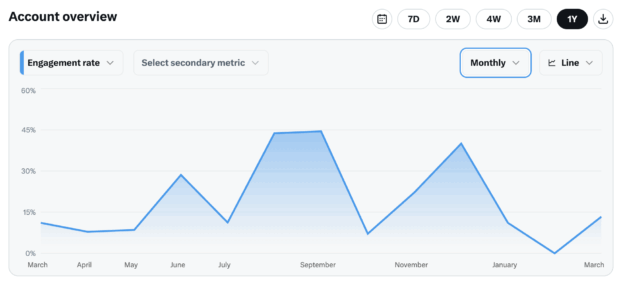
This is your most important "gut check." By dividing total engagements (likes, replies, reposts, clicks) by total impressions, you calculate how well your content resonates. A high engagement rate signals to the algorithm that your content is valuable, which often results in increased distribution.
Follower Growth
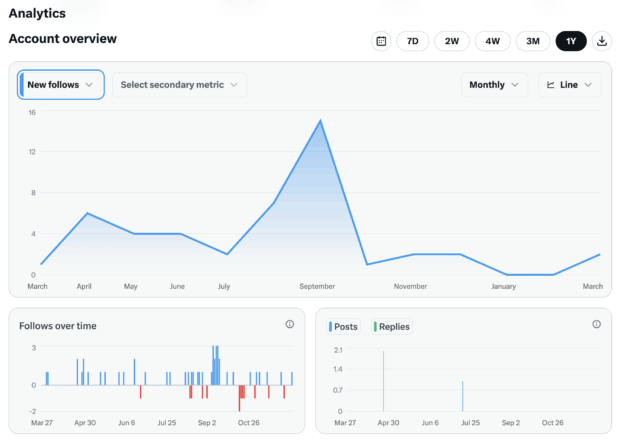
While vanity metrics like total follower count are often discussed, growth rate is a more accurate indicator of brand health. A stagnant or declining follower count often suggests a lack of consistent value or a disconnect between your content and your target audience’s expectations.
Link Clicks
If your marketing goal is conversion-focused, link clicks are your primary KPI. By using UTM parameters or URL shorteners, you can track the journey from an X post to your website, allowing you to prove the tangible business impact of your social presence to stakeholders.
Video Completion Rate
With X’s increased emphasis on video content, "views" are no longer enough. The completion rate tells you if your hook was effective and if the pacing kept the audience’s attention. Low completion rates usually indicate that the first three seconds of your video need to be more compelling.
Official Responses and Platform Philosophy
X has maintained that these changes are designed to improve the quality of the ecosystem. By gating advanced analytics behind Premium, the platform aims to incentivize high-quality content creation and discourage automated spam accounts that previously abused open data.
For the professional marketer, this necessitates a shift in mindset: treat ad revenue sharing (if you are eligible) and analytics as tools for refinement, not the goal itself. The real value of X analytics lies in their ability to inform your creative strategy—using data to identify what sparks conversation, what builds community, and what drives revenue.
Implications: Building a Data-Driven Strategy
To maximize your efforts on X, implement these five strategic shifts:
- Stop Posting in Isolation: Look at your data over weeks and months. One viral post is a fluke; a consistent trend of high-performing content is a strategy.
- Establish Baselines: You cannot improve what you do not measure. Determine your "normal" engagement rate and use that as your benchmark for future campaigns.
- Audit the Competition: Use social listening tools to monitor the public-facing activity of your competitors. If a certain type of post is gaining traction for them, analyze the structure and consider testing a variation in your own voice.
- Connect Social to Sales: Use link tracking to map social performance to your CRM. Senior stakeholders are far more interested in "leads generated" than "likes accrued."
- Listen to Your Audience: The most valuable insights are found in the replies. Use your analytics to find high-engagement posts, then jump into the comments to build deeper relationships with your audience.
Conclusion
In 2026, X analytics are more than just a reporting feature; they are the feedback loop that dictates the success of your brand’s digital presence. Whether you choose to invest in a Premium subscription or utilize third-party tools like Perch, the key is consistency. By prioritizing actionable metrics and using data to guide your creative decisions, you can ensure that your brand remains relevant, engaging, and impactful in a crowded digital space.
As the platform continues to evolve, the marketers who win will be those who view their data not as a series of numbers, but as a map for their brand’s future growth.