The volatile world of memecoins has once again taken center stage as Fartcoin [FARTCOIN] experiences a period of intense turbulence. Over the past several days, the asset has recorded a decline of approximately 13%, a move that has fueled speculation regarding whether the token is heading toward a deeper bearish abyss or preparing for a significant "dead cat bounce" or a legitimate trend reversal. While the immediate price action suggests a strengthening grip by bearish sellers, a deeper dive into the derivatives market reveals a far more complex, multi-layered narrative.
As traders grapple with this sudden drawdown, market analysts are scrutinizing on-chain data and liquidation heatmaps to determine if Fartcoin is nearing a local bottom. This report breaks down the structural mechanics currently governing the price action of FARTCOIN, examining the interplay between retail sentiment, whale positioning, and the high-stakes environment of leveraged derivatives.
Main Facts: The Anatomy of the Sell-Off
The recent 13% decline in Fartcoin’s value did not occur in a vacuum. It was the result of sustained selling pressure that broke through key psychological support levels, triggering a cascade of liquidations for over-leveraged traders.
For those tracking the asset, the primary fact remains that the bearish momentum has been consistent. Sellers have maintained control of the order books, consistently hitting the bid and preventing any sustained recovery attempts. However, the market structure at these lower price points is beginning to show signs of exhaustion. When an asset drops significantly in a short period, it often creates "liquidation clusters"—areas where the market maker or high-frequency trading algorithms may look to test for liquidity before reversing the trend.
Currently, the price of Fartcoin is hovering near a critical junction. While the short-term trend is undeniably down, the derivative metrics are providing a contrasting signal, suggesting that the "smart money" may be preparing for a counter-trend move.
Chronology: How the Decline Unfolded
The slide in Fartcoin’s value followed a period of relative consolidation, where the token failed to break through overhead resistance.
- Initial Weakness: The decline began mid-week as Fartcoin failed to maintain its momentum, signaling a loss of interest from speculative buyers.
- The Liquidation Cascade: As the price slipped, a massive wave of long liquidations hit the exchanges. Data from CoinGlass indicates that approximately $942,000 worth of long positions were wiped out in a single sequence, dwarfing the $18,000 in short liquidations.
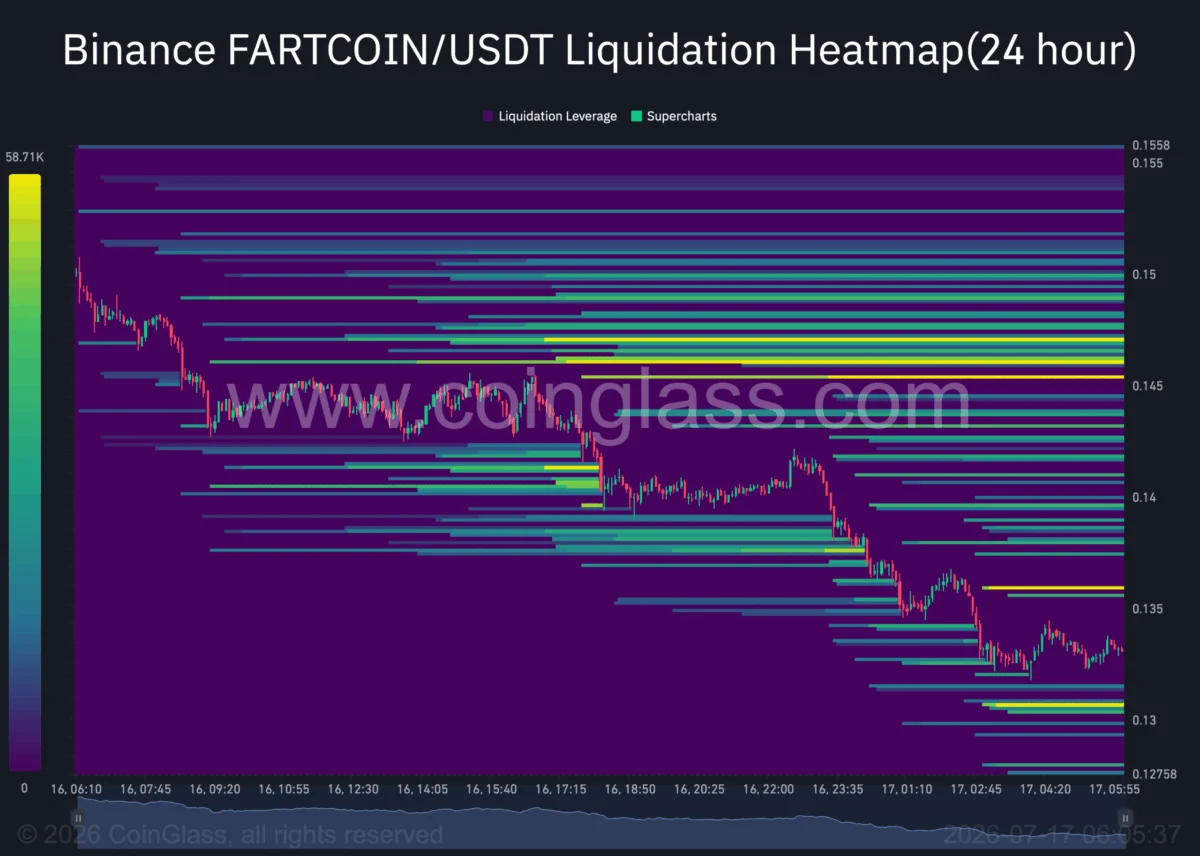
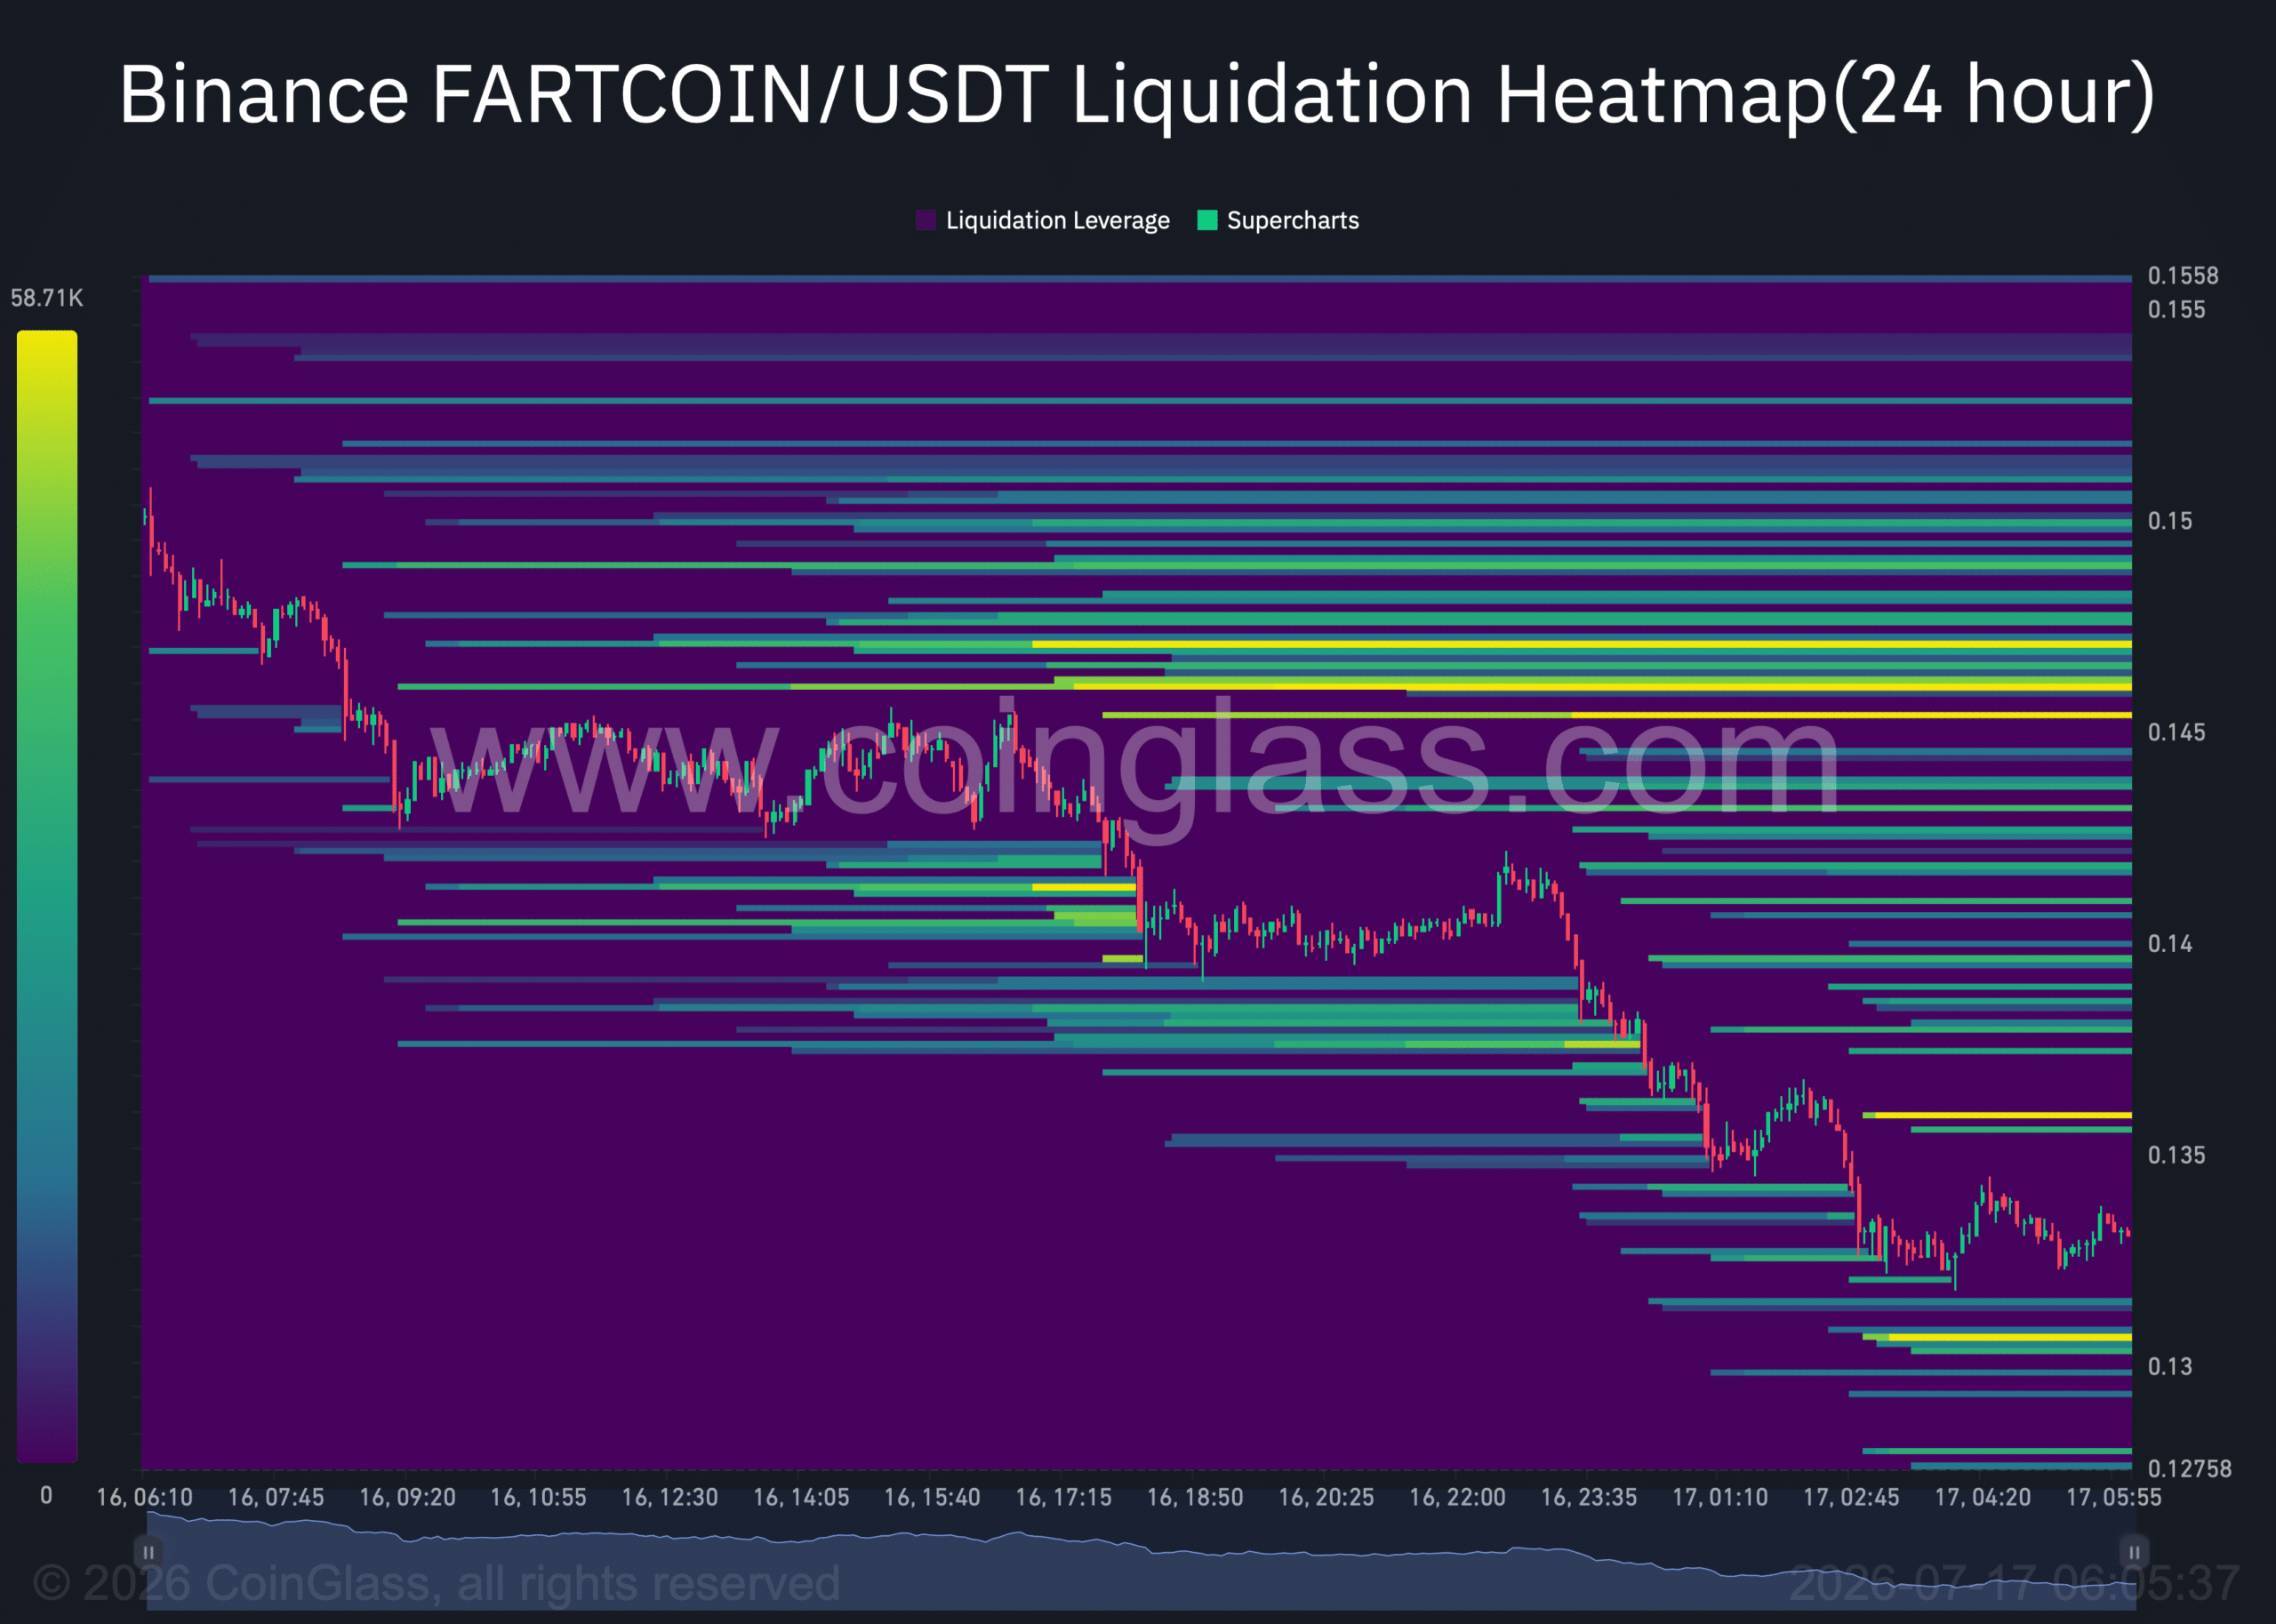
- Current State: The market is now in a "wait and see" phase. The price is currently testing lower liquidity zones, and traders are watching to see if this region holds or if the price will succumb to a "stop-run" further into the $0.130 range.
Supporting Data: The Derivatives Dilemma
To understand why a rebound might be on the horizon, one must look at the specific data points provided by platforms like CoinGlass and Binance.
The Liquidation Heatmap
Binance’s 24-hour Liquidation Heatmap is the most telling indicator for Fartcoin’s near-term path. A significant, albeit modest, cluster of liquidations is currently sitting near the $0.130 mark. In the mechanics of crypto trading, these clusters act like magnets. The market often trends toward these levels to "fill" the liquidity gap. If Fartcoin touches this $0.130 level, it could find enough buy-side liquidity to initiate a meaningful bounce.
Conversely, if the price does rebound, the overhead clusters—specifically those concentrated between $0.145 and $0.147—represent the primary target for bulls. These zones are where a large volume of short positions is sitting; hitting these levels would force those shorts to cover, effectively fueling a short-squeeze rally.
Whale vs. Retail Delta
Perhaps the most intriguing metric is the "Whale-Retail Delta." Data suggests that while retail traders have been panicking, whales have been moving in the shadows. Whales often use volatility to accumulate positions at lower prices, effectively "buying the fear." If the current delta trends toward whale accumulation, it suggests that the "smart money" is not yet ready to abandon the project, but rather, is repositioning for a potential recovery.
The Funding Rate Discrepancy
Despite the price drop, the OI-Weighted Funding Rate remains positive at 0.0051%. This is a crucial detail. A positive funding rate means that long traders are still paying short traders to maintain their positions. This indicates that the market is still structurally "long-biased," even if the price is falling. In many cases, when the funding rate remains positive during a dip, it indicates that traders are buying the dip in anticipation of a quick turnaround.
Official Responses and Sentiment Analysis
While "official" responses from a decentralized memecoin are typically non-existent, the sentiment among the "Top Traders" on major exchanges like Binance provides a proxy for institutional/whale outlook.
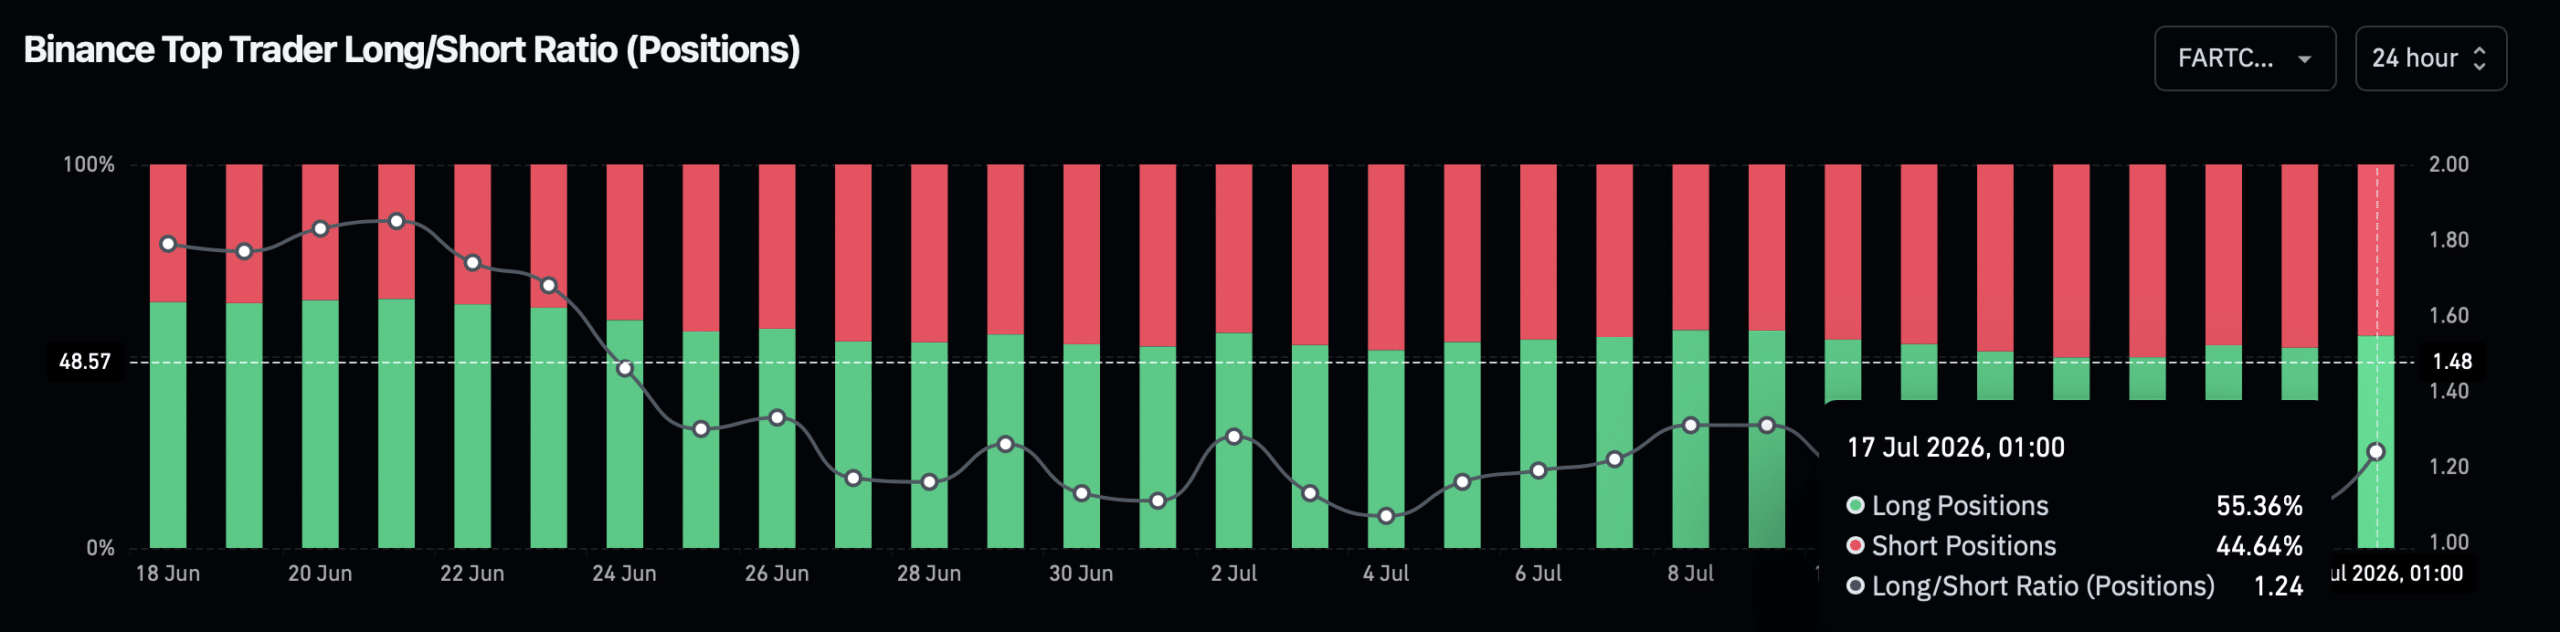
According to the latest data, the top traders are maintaining a bullish bias despite the recent drawdown. Long accounts currently represent over 56% of the total, with long positions accounting for 55.36%. The Top Trader Long/Short Ratio stands at 1.24. This ratio is a strong indicator of sentiment; when it is above 1.0, it suggests that the largest market participants are betting on price appreciation.
This creates a dangerous environment for the bears. If the price manages to climb back above the $0.140 mark, the sheer weight of these "crowded" short positions—which are currently profitable but vulnerable—could lead to a rapid, violent move to the upside as shorts are forced to cover to minimize losses.
Implications: What This Means for Investors
The current state of Fartcoin has several profound implications for market participants, whether they are day traders or long-term holders.
1. The Risk of "Crowded" Shorts
The disparity between the $942,000 in long liquidations and the measly $18,000 in short liquidations suggests that the market is currently "short-heavy." When a market is lopsided in this fashion, the path of least resistance often becomes the one that punishes the majority. If the price fails to break lower, the "short squeeze" potential is significant.
2. The $0.130 "Support Test"
The $0.130 level is the defining line for the next few days. If the price holds this level, it confirms that the market has successfully absorbed the selling pressure. If it breaks, however, it could trigger a stop-loss cascade that leads to a much deeper retracement, potentially testing levels not seen in the current cycle.
3. The Role of Volatility
For the casual observer, the 13% drop might look like a death knell. However, in the context of memecoin volatility, this is often "par for the course." The real story is not the drop itself, but the resilience of the funding rates and the behavior of the whale addresses.
4. Strategic Positioning
For those looking to trade the volatility, the current data suggests that the "bottom" may be near, but it is not guaranteed. A prudent strategy involves watching the $0.130 liquidity cluster. If that zone is tapped and the price shows immediate rejection (a "wick" on the chart), it would be a strong technical signal of a local bottom. Conversely, holding long positions while the funding rate is positive carries a cost, and traders must be prepared for the possibility that the "rebound" might take longer to materialize than the derivatives data suggests.
Conclusion: Is the Tide Turning?
Fartcoin finds itself in a classic high-stakes setup. The technicals show a clear bearish trend, but the underlying data—specifically the whale accumulation, the positive funding rates, and the lopsided Top Trader Long/Short ratio—suggests that the bearish momentum is becoming exhausted.
The next 48 to 72 hours will be decisive. Fartcoin must demonstrate its ability to defend the $0.130 liquidity zone. If it succeeds, the potential for a move toward the $0.145–$0.147 cluster is high, setting the stage for a recovery that could potentially wipe out the recent losses. However, investors must remain vigilant. In the memecoin sector, sentiment can shift in an instant, and the same metrics that currently signal a rebound could be invalidated by a sudden change in overall market sentiment or a major sell-off in the broader crypto ecosystem.
As it stands, the "smart money" seems to be betting on a recovery. Whether the rest of the market follows suit remains the central question for Fartcoin in the coming days. Investors are advised to monitor the liquidation heatmaps closely, as any deviation from the current, established order could signal a shift in the broader trend. Keep your eyes on the liquidity—that is where the truth of the market is currently written.