
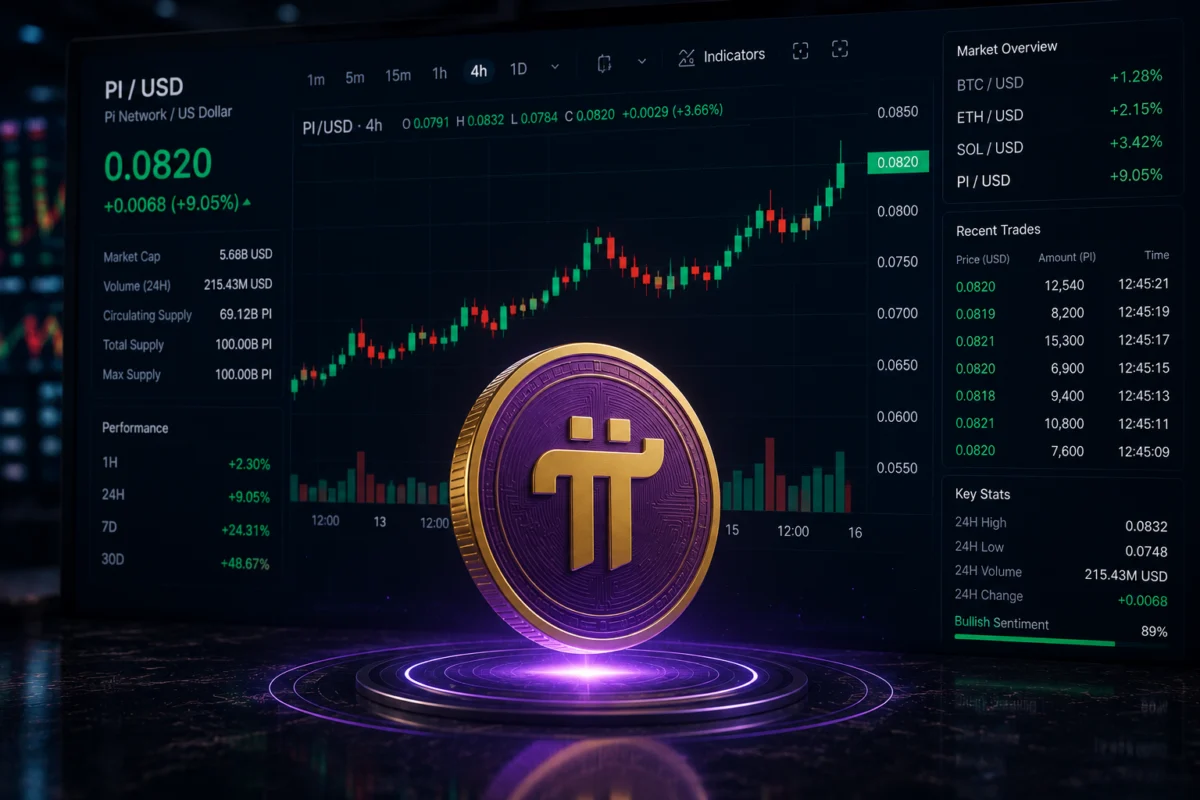
Pi Network (PI), one of the most unique and widely debated assets in the cryptocurrency ecosystem, is showing nascent signs of a potential turnaround. After enduring a grueling series of downward sessions, the token has finally exhibited signs of stabilization. Following three days of sideways trading, market participants are now watching closely to see if this represents a mere consolidation before further losses or the foundational work for a legitimate relief rally.
Main Facts: A Market at a Crossroads
As of mid-July 2026, Pi Network (PI) is attempting to claw back some of the value lost during a sharp correction earlier this month. The asset, which functions as a highly speculative, community-driven token, has spent the last several weeks navigating a broader downtrend that has tested the resolve of its retail-heavy investor base.
The current price action is characterized by a lack of strong volatility—a stark contrast to the aggressive selling pressure seen in early July. This shift suggests that the "easy" money has already been made by short-sellers and that the market may have reached a point of exhaustion. With the price hovering near critical technical floors, the focus has shifted from panic-driven liquidation to tactical accumulation, as traders search for signals of a reversal.
Chronology: From Correction to Cautious Recovery
To understand the current state of PI, one must look at the recent timeline of events:
- Early July 2026: PI experienced a severe liquidity crunch and a sharp, rapid decline in price, triggered by a combination of general market volatility and cooling sentiment regarding community-led projects.
- Mid-July 2026: After hitting local lows, the asset entered a phase of extreme volatility, eventually settling into a period of sideways consolidation.
- The Current Week: PI broke its streak of consistent daily losses, trading horizontally for three consecutive sessions. This period of "coiling" is often interpreted by analysts as a transition zone where the market waits for a catalyst to determine the next major trend.
- Looking Ahead: Investors are pinning their hopes on late-July market developments, specifically the Stellar Protocol’s upcoming version 25 mainnet upgrade, which is viewed as a potential sentiment booster for the entire Stellar-adjacent ecosystem.
Supporting Data: Derivatives and Technical Indicators
The argument for a potential rebound is supported by two distinct pillars: on-chain derivatives data and technical chart patterns.
The Rise of Open Interest
According to data from CoinAnk, the derivatives market is signaling a return of speculative interest. As of Friday, Pi Network’s Open Interest (OI) climbed to $10.73 million, up from the $10.44 million recorded just 24 hours prior. Even more compelling is the recovery from the $9.11 million low seen on Monday.
A rising Open Interest, when paired with stabilizing or slightly increasing prices, is a hallmark of new capital entering the market. It suggests that while conviction remains "modest," the appetite for risk is returning, and traders are actively positioning themselves to capture a potential upside breakout.
Technical Analysis: The Oversold Narrative
From a technical perspective, PI is currently locked in a classic "falling channel." However, it is also sitting in a region that has historically acted as a safety net.

- The RSI Factor: The Relative Strength Index (RSI) for PI has dropped to approximately 17. In traditional technical analysis, an RSI below 30 indicates that an asset is "deeply oversold." While this does not automatically trigger a price jump, it serves as a warning to bears that the momentum behind the sell-off has likely become stretched and is prone to a sharp, snap-back reversal.
- Fibonacci Support: The 161.8% Fibonacci extension level, situated at $0.06793, is currently the most vital support line. The price action’s ability to "dance" around this level without a decisive breakdown suggests that buyers are stepping in to defend this zone.
- MACD Divergence: The Moving Average Convergence Divergence (MACD) remains in bearish territory (below the zero line). However, the histogram is showing a reduction in the intensity of the downward trend. This "weakening bearish momentum" is often the first indicator that a trend reversal may be on the horizon.
Official Responses and Ecosystem Sentiment
While the Pi Network core team often maintains a measured approach to market fluctuations, the broader community remains the heartbeat of the project. Unlike centralized tokens backed by institutional giants, PI’s valuation is inherently tied to the activity of its vast, global user base.
The upcoming Stellar Protocol version 25 upgrade, scheduled for July 22, has become a focal point for the community. Because many assets within the Pi-adjacent landscape rely on Stellar-based infrastructure, developers and community influencers are watching the upgrade as a "litmus test" for network stability and efficiency. If the upgrade proceeds smoothly, it could serve as a psychological catalyst, helping to lift the "cloud of uncertainty" that has dampened sentiment throughout the month.
Implications: What Lies Ahead for PI?
The road to recovery for Pi Network is fraught with hurdles. To turn the tide, the token must overcome significant resistance levels that have been established during its decline.
Resistance Levels to Watch
- First Hurdle ($0.09613): A push above the 127.2% Fibonacci extension is the immediate goal. A sustained close above this level would signal that the bulls have regained control of the short-term trend.
- Major Ceiling ($0.110): The upper boundary of the current falling channel sits near the $0.110 mark. This is a critical "make or break" zone. Unless broader crypto market sentiment shifts from neutral-bearish to definitively bullish, breaking through this ceiling will be a difficult task for PI.
The Downside Risk
Conversely, the market cannot ignore the danger of the "support floor." Should the $0.06793 level fail to hold under sustained selling pressure, the technical structure of the chart changes significantly. A decisive break below this support could lead to a liquidity vacuum, potentially exposing the price to the 227.2% Fibonacci extension near $0.01463. Such a drop would represent a fundamental breakdown of the current recovery narrative and could lead to a prolonged period of stagnation.
Conclusion: A Delicate Balance
Pi Network finds itself in a classic market tug-of-war. On one side, the token is technically "screaming" that it is oversold, with derivatives data confirming that capital is slowly flowing back into the market. On the other side, the broader trend remains resolutely bearish, and the asset has yet to prove that it can reclaim the key resistance levels necessary to invalidate the current downtrend.
For the average holder, the current environment is one of extreme caution. While the potential for a "relief rally" is supported by data, it is important to remember that sentiment in the crypto space can change on a dime. Investors should look for a confirmed breakout above $0.09613 as a sign that the worst of the volatility is behind them. Until that resistance is reclaimed, the outlook remains cautiously optimistic, but ultimately tentative.
As the industry approaches the end of July, all eyes will be on the combination of the Stellar upgrade and the ability of PI to maintain its current support levels. If the current momentum holds, the coming weeks could prove that even the most heavily corrected assets can find a path to stability when the selling pressure finally runs dry.