In the era of AI-driven decision-making, the mantra "garbage in, garbage out" has never been more relevant. As organizations race to integrate artificial intelligence, machine learning, and advanced analytics into their core business processes, the foundation of these technologies—data—is facing unprecedented scrutiny. Data quality is no longer just a technical checkbox for IT departments; it is a critical business imperative that determines the success or failure of digital transformation initiatives.
This guide provides a comprehensive framework for organizations to move beyond abstract goals and implement concrete, actionable data quality metrics.
The Strategic Imperative: Why Data Quality Matters Now
Data quality metrics serve as the definitive barometer for whether information is fit for its intended use. In a modern enterprise, data is the raw material for everything from customer experience personalization to supply chain optimization and AI model training. When this material is flawed, the entire value chain suffers.
The Evolution of Data Quality
For years, data quality was viewed through the narrow lens of database maintenance—ensuring that names were spelled correctly or that zip codes matched city records. Today, the scope has expanded. With the rise of unstructured data and AI, "quality" now encompasses dimensions like relevance and timeliness, which were previously sidelined.
As noted in the BARC Data, BI, and Analytics Trend Monitor 2026, data quality management remains a top priority for global organizations. This sustained focus highlights a persistent gap between the desire for data-driven insights and the reality of fragmented, unreliable data estates.
Defining the Framework: Dimensions and Measurement
To measure data quality effectively, one must first decompose it into measurable components. Data quality dimensions provide the mental model necessary to analyze requirements and identify issues.

The Core Dimensions of Quality
- Accuracy: Does the data correctly reflect the real-world object or event it represents?
- Completeness: Is all necessary data present? (e.g., Are all mandatory fields populated in a customer record?)
- Consistency: Is the data uniform across different systems and applications?
- Timeliness: Is the data available when the business needs it, and is it current?
- Validity: Does the data conform to defined syntax, format, and range requirements?
- Uniqueness: Is there any duplication of records that could skew analysis?
- Relevance: Is the data actually useful for the specific business context or AI use case?
From Requirements to Metrics
Measurement should always begin with a specific business use case. Consider a B2B e-commerce firm processing online orders. If the objective is to ensure automated email confirmations are delivered, the requirement is a "Primary Email Address."
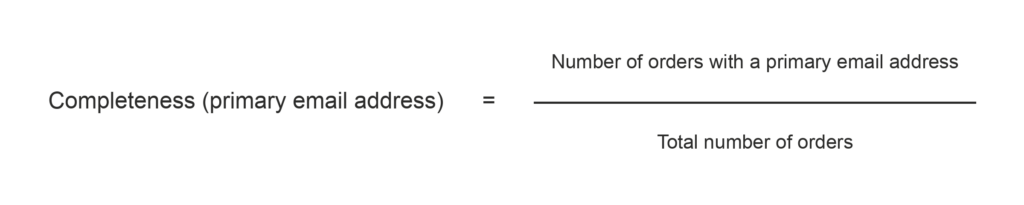
The dimension here is completeness. The metric is calculated as:
- (Number of orders with a valid, non-null email address / Total number of orders) × 100 = % Completeness
This simple ratio provides a 0% to 100% score that is immediately understandable to business stakeholders.
Chronology of a Data Quality Program
Implementing a successful data quality program is an iterative process, not a one-time project. Organizations typically progress through these stages:
- Requirement Mapping: Business domains define what "good" data looks like for their specific processes.
- Rule Definition: Data engineers codify requirements into testable conditions (e.g., "The email field must contain an ‘@’ symbol and a domain suffix").
- Implementation of Checks: Using SQL scripts, Python routines, or specialized Data Quality (DQ) tools, the organization executes these rules against production data.
- Metric Aggregation: Individual check results are aggregated into business-friendly KPIs.
- Monitoring and Escalation: Dashboards track performance against established baselines, triggering alerts when data quality drifts.
- Remediation: Data stewards act upon alerts to resolve the root causes of quality degradation.
Supporting Data: The AI Readiness Context
The transition to AI-centric workflows has forced a re-evaluation of which quality dimensions matter most. In the 2026 BARC survey regarding Managing Unstructured Data (n=195), researchers Kevin Petrie and Merv Adrian explored how organizations assess the "AI readiness" of their data.
- Accuracy: Cited by 54% of respondents as the most critical dimension.
- Timeliness: Cited by 31% of respondents.
This data suggests that while traditional metrics like completeness remain foundational, accuracy and speed are the primary bottlenecks for AI adoption. As organizations move from descriptive analytics to predictive and generative AI, the requirement for high-fidelity data becomes non-negotiable. If an AI model is trained on inaccurate data, the resulting "hallucinations" or biased outcomes can cause significant reputational and operational damage.

Official Guidelines: Best Practices for Success
To move from measurement to improvement, organizations must follow these structured best practices:
1. Identify Business-Critical Data
Don’t attempt to boil the ocean. Start with the data that directly impacts revenue, regulatory compliance, or strategic decision-making. Map these elements to the business processes that consume them.
2. Establish Contextual Thresholds
A metric without a target is just a statistic. Define:
- Baselines: The current state of the data.
- Targets: The desired level of quality (e.g., 99.9% completeness for customer emails).
- Escalation Thresholds: The point at which the degradation of quality requires human intervention.
3. Avoid "Alert Fatigue"
One of the most common failures in DQ programs is over-alerting. If a data steward receives 50 notifications a day, they will quickly stop looking at them. Focus on high-impact thresholds. Use intelligent anomaly detection—similar to IT observability practices—to distinguish between noise and genuine systemic failure.
4. Assign Ownership
A metric must have a "named reviewer." If no one is accountable for the data, the quality will inevitably decay over time. Data stewardship is not just an IT task; it is a collaborative effort between data producers (business units) and data consumers (analysts/data scientists).
Implications: The Future of Data Quality Management
The landscape of data quality management is undergoing a fundamental shift, moving toward Data Observability.
Observability vs. Traditional DQ
While traditional DQ focuses on batch-style rule checking, modern observability focuses on the entire lifecycle of data. This includes:
- Volume: Are we receiving the expected amount of data?
- Distribution: Have the patterns of the data changed unexpectedly?
- Lineage: If a report is wrong, can we trace it back to the source system?
This shift is largely driven by the increasing complexity of cloud-native data stacks and the need to support real-time streaming analytics.
The Role of Automation
As datasets grow into the petabyte range, manual rule definition becomes impossible. AI-powered tools are now being used to automatically profile data, suggest quality rules, and detect anomalies without human intervention. This automation is essential for scaling data quality programs across the enterprise.
Conclusion
Data quality is the invisible engine of the digital economy. While the definitions of "accuracy" and "completeness" remain constant, the methods of measuring them are evolving rapidly. By grounding your data quality strategy in business use cases, setting clear and actionable thresholds, and embracing the principles of data observability, organizations can ensure that their data remains a reliable asset rather than a liability.
The path forward is clear: define the requirements, measure the impact, and continuously refine the process. As noted in the BARC Compass for Data Quality Management, those who master these eight core processes and integrate them into their organizational culture will be the ones who successfully harness the power of AI and data-driven innovation.
FAQ: Quick Insights
What distinguishes a metric from a KPI?
A metric is a raw measurement of a specific data attribute (e.g., "92% of records are complete"). A KPI is a metric that is tied to a specific, high-level management objective (e.g., "Maintain 99% accuracy in shipping addresses to reduce return costs by 5%").
How do I handle false positives in automated alerts?
False positives often occur when thresholds are too static. Use dynamic thresholds that account for seasonality or expected data fluctuations. Regularly review the alert logs with data stewards to tune the sensitivity of the monitoring systems.
Is 100% data quality always the goal?
Not necessarily. Achieving 100% data quality often carries a cost that outweighs the benefits. The goal should be "fit for purpose"—achieving the level of quality required to make the intended business decision safely and effectively.
How does AI change the data quality landscape?
AI introduces the challenge of "black box" quality. Because AI models are sensitive to data distributions, even small, subtle errors in data quality can have massive impacts on model performance. This necessitates a shift toward monitoring data distribution rather than just individual record validity.