Introduction: A New Year, A New Outlook for Hospitality
As the U.S. hospitality sector transitions into the first quarter of 2026, industry analysts are closely parsing the latest performance metrics released by CoStar and STR. Following a year characterized by lackluster demand and tepid growth in 2025, the industry’s performance for the week ending January 3, 2026, offers a glimmer of optimism. With an occupancy rate climb of 4.4% year-over-year, stakeholders are questioning whether this uptick signals a genuine rebound or merely a statistical blip following a historically soft period.
While January is traditionally a period of subdued travel activity—typically marked by the post-holiday slump—the data suggests that the sector is beginning 2026 on firmer footing than it concluded the previous year. This report examines the foundational metrics of the U.S. hotel industry, the seasonal nuances of occupancy trends, and the broader economic implications for property owners, investors, and the traveling public.
Main Facts: Breaking Down the Weekly Performance
The data provided by CoStar, covering the week of December 28, 2025, through January 3, 2026, serves as the primary benchmark for the start of the new fiscal year. The results demonstrate a synchronized growth across all primary Key Performance Indicators (KPIs):
- Occupancy Rate: Reached 50.5%, reflecting a 4.4% increase compared to the corresponding period in the previous year.
- Average Daily Rate (ADR): Climbed to US$175.47, an increase of 3.4%.
- Revenue per Available Room (RevPAR): Experienced the most significant growth, jumping 7.9% to reach US$88.65.
These figures are critical because they represent the "triple crown" of hotel performance metrics. When occupancy, ADR, and RevPAR grow simultaneously, it indicates that hotels are not only successfully filling rooms but are also commanding higher prices for those rooms, thereby expanding profit margins. The 7.9% surge in RevPAR is particularly noteworthy, as it suggests that the industry is successfully capturing higher yields despite the seasonal volatility inherent in early January.
Chronology of Recent Performance
To understand the current trajectory, one must look at the recent history of the hotel sector. The year 2025 was widely regarded as a period of "weakness" by industry observers. Following the post-pandemic "revenge travel" boom that characterized 2022 and 2023, the industry faced a cooling-off period in 2025. Rising operational costs, inflationary pressures on consumers, and a normalization of leisure travel demand created a challenging environment for operators.
2025: A Year of Stagnation
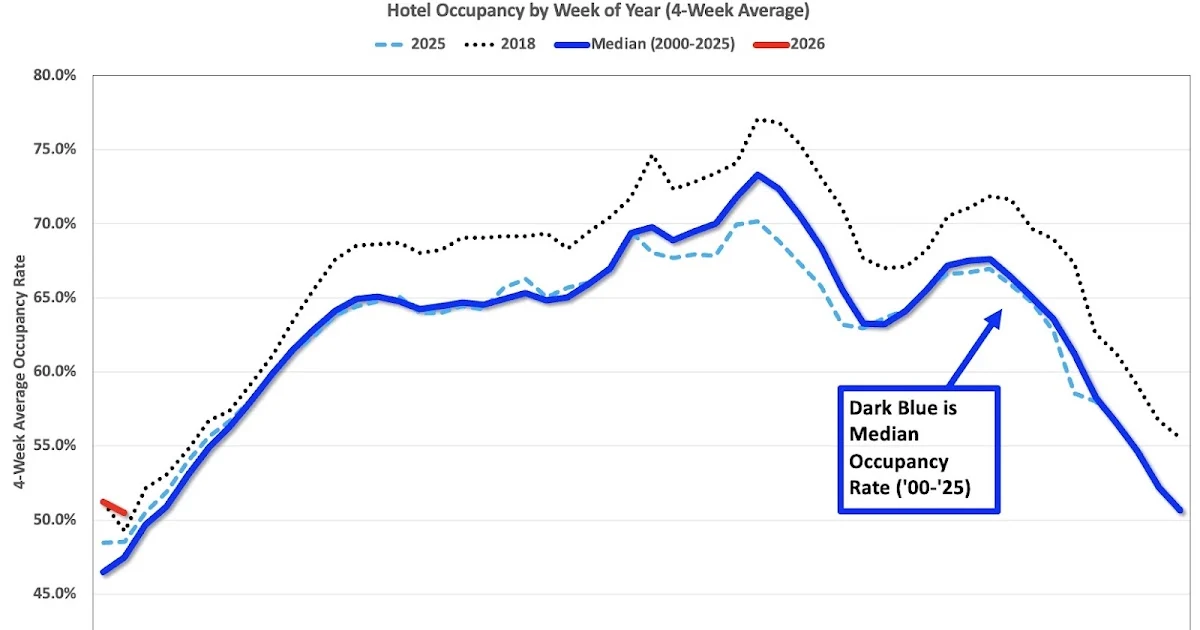
Throughout the majority of 2025, hotel occupancy rates struggled to maintain the peaks observed in the post-2020 recovery years. While the record-setting year of 2018 remains the "gold standard" for occupancy in modern U.S. hospitality, the 2025 performance curve consistently trailed both the median and the historical highs.
Late December 2025 – Early January 2026: The Inflection Point
The week concluding on January 3, 2026, serves as the bridge between the stagnation of 2025 and the potential growth of 2026. Because this week encompasses both the New Year’s holiday and the subsequent return to business and school, it is a volatile period. However, the 4.4% year-over-year increase suggests that travelers were more willing to engage in hospitality services than they were during the same transition period twelve months prior.
Supporting Data: Visualizing the Seasonal Curve
The industry utilizes a "four-week average" to smooth out the volatility of individual weeks. This methodology is essential for identifying trends that might otherwise be obscured by holiday fluctuations or one-off events.
The Four-Week Average Analysis
The current graph tracking these trends illustrates a clear seasonal pattern. The red line (representing 2026) is currently positioned above the dashed light blue line (representing 2025). This positioning is a vital indicator of momentum. While the industry is still far from the peak occupancy levels seen in the record-setting year of 2018 (represented by the dashed black line), the upward trajectory of the four-week average suggests that the sector is entering a period of seasonal expansion.
Understanding the Y-Axis Nuance
It is important to note that the Y-axis on industry charts does not start at zero. This design choice is intentional. By narrowing the focus to the range of historical occupancy fluctuations, analysts can more clearly visualize the incremental changes that might otherwise appear flat. Even a 1% or 2% change in occupancy can represent millions of dollars in revenue across the national footprint; therefore, the visual emphasis on these small margins is necessary for high-level industry analysis.
Official Perspectives and Industry Commentary
While official responses from major hotel chains and industry associations are pending detailed Q1 reports, the sentiment from analytical firms like CoStar and STR remains cautiously optimistic.

Industry experts note that while the 4.4% growth is statistically significant, it must be viewed in the context of the "base effect." Because the baseline from early 2025 was relatively low, the percentage increase may appear more dramatic than it would be in a high-growth, stable environment.
Furthermore, the increase in ADR (Average Daily Rate) suggests that hoteliers are maintaining pricing power. Despite concerns regarding consumer spending power in a high-interest-rate environment, the fact that ADR rose by 3.4% indicates that the industry has not yet resorted to aggressive discounting to fill rooms—a sign of relative market health.
Implications for the Hospitality Industry
The early 2026 data carries significant implications for various stakeholders within the hospitality ecosystem.
For Hotel Investors and REITs
Real Estate Investment Trusts (REITs) and private equity firms focused on hospitality will view these numbers as a validation of the resilience of the sector. If RevPAR continues to grow in the high single digits, it will bolster investor confidence, potentially leading to increased capital expenditure (CapEx) for property renovations and technology upgrades. Investors are looking for sustained growth that outpaces inflation; the 7.9% RevPAR growth recorded in the first week of 2026 is an encouraging signal in that regard.
For Operational Management
For hotel managers, the challenge remains the high cost of labor and energy. While the 4.4% occupancy increase is positive, it must be converted into net operating income (NOI). Managers are likely to continue utilizing dynamic pricing algorithms to ensure that the ADR growth seen in early January is maintained throughout the upcoming spring conference season and summer vacation periods.
For the Traveling Public
Consumers should anticipate that the rising RevPAR and ADR figures may translate into higher costs for room bookings. As the industry recovers and occupancy rates climb, the "deals" that were frequently available in 2025 may become scarcer. The data suggests a shift toward a "seller’s market," where demand is recovering faster than supply in certain high-traffic corridors.
Macro-Economic Considerations
The hospitality sector is often viewed as a "canary in the coal mine" for the broader economy. Because travel is a discretionary expenditure, hotel performance is inextricably linked to consumer confidence. A rise in occupancy suggests that households still possess the disposable income—or the willingness to spend—on travel. If this trend holds, it could be a positive indicator for the broader services sector in 2026.
Conclusion: Looking Ahead to the Spring Season
As we progress through the first quarter of 2026, the four-week average will be the most important metric to monitor. The industry is entering the time of year where business travel traditionally picks up, following the quiet winter holidays.
The 4.4% year-over-year increase in occupancy is a welcome start, but industry observers are waiting to see if this trend persists beyond the early-year noise. If the industry can maintain or improve upon this momentum, 2026 could represent a year of stabilization and growth, moving further away from the post-pandemic volatility that defined 2025.
While the record heights of 2018 remain a distant benchmark, the current data suggests that the U.S. hotel industry is not only surviving the post-pandemic transition but is actively building a path toward sustainable, long-term performance. Investors, travelers, and operators alike will be watching the upcoming monthly reports with keen interest to see if this January pulse develops into a consistent heartbeat for the year to come.