The U.S. hospitality sector, which navigated a period of sluggish performance throughout 2025, has kicked off the new year with a notable uptick in demand. According to the latest data released by CoStar, the week ending January 3, 2026, saw a promising 4.4% year-over-year increase in hotel occupancy rates, signaling a potential shift in consumer travel habits as the industry moves into the first quarter.
While analysts caution that early January data can be notoriously volatile due to seasonal post-holiday lulls, the industry’s performance metrics—including Average Daily Rate (ADR) and Revenue Per Available Room (RevPAR)—paint a picture of strengthening fundamentals. As the hotel sector looks to move past the tepid growth that characterized the previous year, stakeholders are carefully monitoring these initial indicators to gauge whether they represent a sustained recovery or a brief, holiday-influenced anomaly.
The Core Data: A Breakdown of Weekly Performance
The report provided by CoStar for the period of December 28, 2025, through January 3, 2026, serves as the primary benchmark for the start of the new fiscal year. The data reveals that the industry is not just seeing more guests, but is also successfully leveraging pricing power.
Key Performance Indicators (KPIs)
- Occupancy: 50.5%, representing a 4.4% increase compared to the same period in the prior year.
- Average Daily Rate (ADR): $175.47, reflecting a 3.4% rise.
- Revenue Per Available Room (RevPAR): $88.65, demonstrating a robust 7.9% gain.
The significant jump in RevPAR—a critical metric for hotel profitability—is particularly telling. Because RevPAR is a function of both occupancy and room rates, the 7.9% increase suggests that hoteliers were able to command higher prices even while managing higher volumes of guests. This decoupling of volume and pricing power is a positive sign for investors who were concerned that the sector might be forced to lower rates to stimulate demand in a soft economy.
Chronology: Navigating a Challenging 2025
To understand the significance of this early 2026 data, one must look back at the landscape of 2025. Throughout the last year, the hospitality industry faced a "headwind" of cooling consumer spending and rising operational costs.
Q1 – Q2 2025: The Initial Slowdown
Early 2025 was marked by a normalization of post-pandemic travel patterns. As the "revenge travel" boom of the previous two years tapered off, many hotels saw occupancy rates stagnate. The year began with a cautious optimism that was quickly tempered by inflationary pressures affecting household discretionary budgets.
Q3 2025: Operational Hurdles
By mid-year, the industry was grappling with high interest rates and increased labor costs. While urban centers and major business hubs saw consistent traffic, secondary markets struggled to maintain occupancy levels above the 60% mark. During this period, the four-week moving average—a key gauge used by analysts to smooth out the volatility of individual weeks—began to hover below the median trends observed in previous years, excluding the pandemic-disrupted periods.
Q4 2025: Seeking Stability
The final quarter of 2025 showed signs of stabilization, but the growth was uneven. Despite a strong holiday push in late December, the overall annual performance left many industry analysts asking if the hospitality sector had hit a "growth ceiling." The emergence of the early January 2026 data provides the first real counter-narrative to the stagnation narrative that dominated the late-year headlines.
Supporting Data: Visualizing the Seasonal Shift
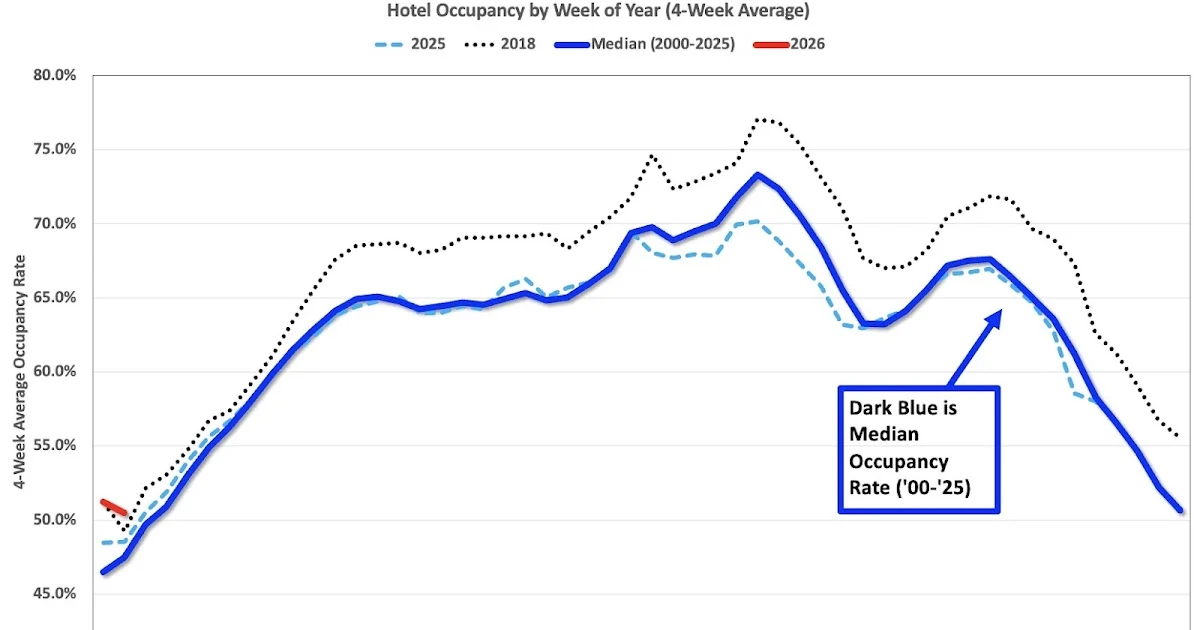
The seasonal pattern of the hotel industry is cyclical and predictable, but the trajectory of 2026 is already being compared against several historical markers. Industry experts utilize a four-week moving average to filter out the "noise" of short-term holiday fluctuations.
Comparing the Trends
- The 2026 Trajectory (Red Line): Currently, the initial data point for 2026 shows a sharp upward move compared to the year-end lows.
- The 2025 Baseline (Dashed Light Blue): The 2025 data serves as the immediate point of comparison, and early indicators suggest 2026 is tracking slightly above this line.
- The 2018 Benchmark (Dashed Black): 2018 remains the gold standard for the modern hospitality industry, representing a period of peak economic prosperity and record-high occupancy. While 2026 is currently below the 2018 levels, the positive momentum suggests the industry is narrowing the gap.
It is important to note that the y-axis on these industry graphs is often truncated to better visualize the seasonal variances. While the 4.4% growth looks dramatic in a zoomed-in graph, it represents a meaningful, albeit incremental, improvement in a highly competitive market. Analysts expect this moving average to trend upward over the next three months as spring break travel and early-year corporate conferencing activity pick up.
Official Responses and Industry Sentiment
While official statements from major hotel chains have been guarded, the sentiment on Wall Street and among hotel asset managers is one of "cautious optimism."

"We are seeing a resilience in travel demand that defies some of the broader macroeconomic concerns," noted one senior industry analyst. "The fact that hotels are maintaining a 3.4% increase in Average Daily Rate while simultaneously growing occupancy by 4.4% indicates that the consumer remains willing to pay for travel experiences, provided the value proposition remains clear."
However, not all industry participants are celebrating. Labor unions and hospitality staffing agencies have pointed out that while occupancy is up, the cost of providing that hospitality has also risen. The "spread" between revenue growth and profit margin expansion remains tight. Major chains are expected to address this in their upcoming Q1 earnings calls, focusing heavily on operational efficiency and the integration of AI-driven demand forecasting to optimize room pricing in real-time.
Implications: What This Means for the Future
The 4.4% increase in occupancy is more than just a number; it carries significant implications for the hospitality sector’s trajectory for the remainder of 2026.
1. Pricing Power Retention
The ability to sustain a 3.4% increase in ADR suggests that the pricing power of hotels has not been eroded by the sluggish performance of 2025. If this trend holds, it provides a buffer against the rising costs of energy, labor, and maintenance.
2. Business Travel Recovery
A significant portion of the early January volume is driven by business and group travel. The positive shift suggests that corporate travel budgets, which were scrutinized heavily in 2025, are being released earlier in 2026. This is a critical indicator, as corporate travel remains the highest-margin segment for major city hotels.
3. Investment and Development
The hotel investment market has been in a "wait and see" mode for the last 18 months. If the positive trend continues through Q1, we can expect a surge in capital allocation toward hotel renovations and new developments. Investors look for consistent year-over-year RevPAR growth as a signal that the market has absorbed the supply increases of previous years.
4. Macroeconomic Indicator
Because the hospitality industry is highly sensitive to discretionary spending, it serves as a leading indicator for the broader economy. If consumers are spending on travel, it suggests that the "soft landing" or economic stability that many economists hope for is taking hold. Conversely, if occupancy dips in February or March, it could signal that the early year strength was merely a reflection of pent-up demand being exhausted.
Conclusion
The U.S. hotel industry has started 2026 with a degree of momentum that was absent for much of the previous year. With a 4.4% increase in occupancy and a healthy 7.9% growth in RevPAR, the industry is demonstrating that demand is not only present but is becoming more profitable.
While it is still too early to declare a full-scale boom for 2026, the initial data serves as a vital proof-of-concept for hoteliers. The focus for the next quarter will be on whether this growth can be sustained across different market segments—particularly the luxury and mid-scale tiers—and how effectively management teams can balance the upward pressure on ADR with the need to keep occupancy levels high.
As the seasonal patterns of the year continue to unfold, all eyes will be on the four-week moving average. If it maintains its current trajectory, 2026 could very well be the year the hospitality industry finally moves out of the shadow of 2025 and back into a period of sustainable, long-term growth. Investors, travelers, and industry analysts alike will continue to scrutinize the weekly CoStar reports, searching for the next signal that defines the direction of the travel economy. For now, the industry has every reason to be encouraged by the numbers on the ledger.