In the hyper-competitive landscape of 2026 digital marketing, follower counts are no longer the "north star" metric they once were. As algorithms grow increasingly sophisticated, prioritizing meaningful interaction over passive consumption, the true currency of social media has become the Engagement Rate. Whether you are an enterprise brand aiming for global reach or a creator building a community, understanding how your audience interacts with your content is the difference between visibility and irrelevance.

What Is Engagement Rate and Why It Defines Success
At its core, engagement rate is a performance metric that quantifies the level of interaction your audience has with your content relative to your reach or follower base. It is the definitive signal that your content has moved beyond mere impressions to provoke a reaction—whether that be a like, a comment, a share, a save, or a click.

Why does this matter? For starters, social media algorithms—the gatekeepers of modern content discovery—are hardwired to promote high-engagement content. When users interact with a post, the algorithm interprets this as a "quality signal," surfacing that content to wider, new audiences. Furthermore, a high engagement rate acts as social proof. When a first-time visitor lands on your profile and sees an active, vibrant comment section, they are significantly more likely to trust your brand and hit the "follow" button.
The Taxonomy of Engagement: A Platform-Specific Breakdown
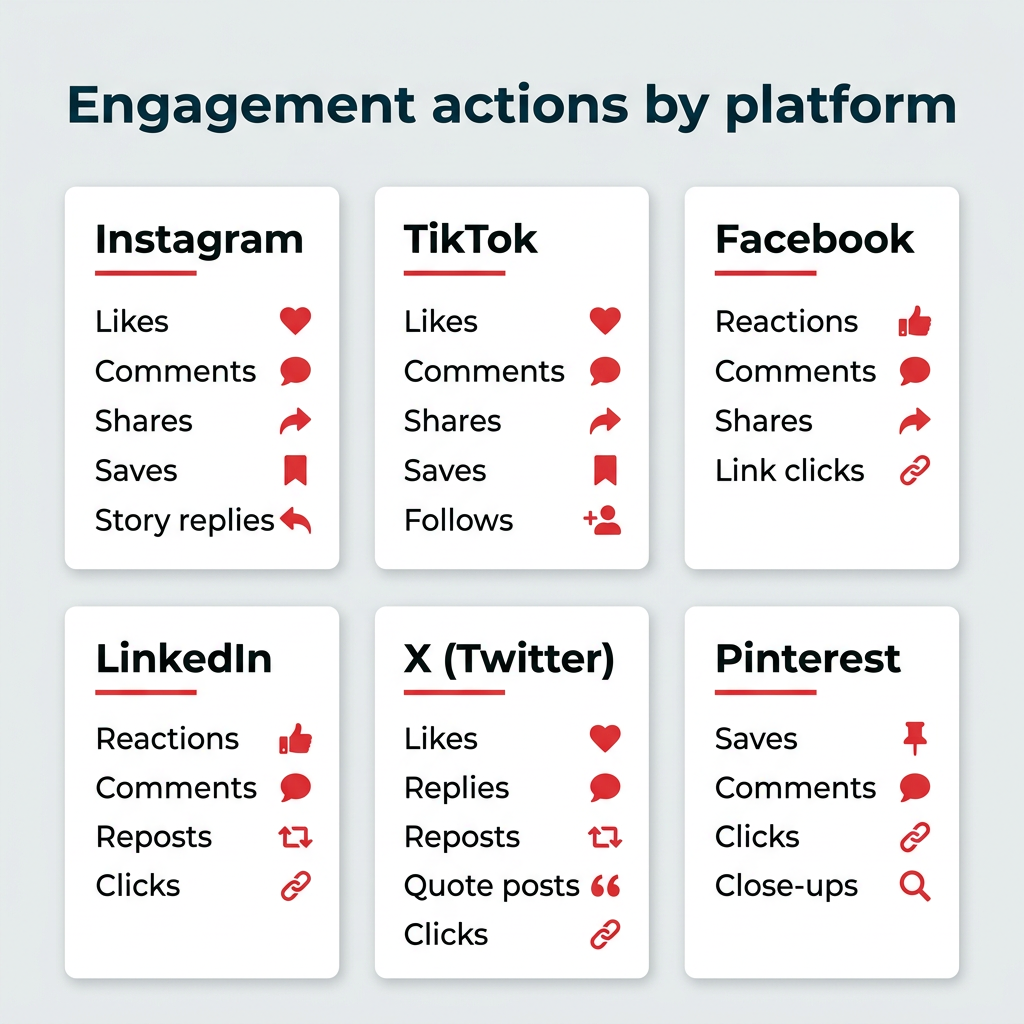
Engagement is not a monolithic metric; it is defined by the unique architecture of each social platform. Passive metrics, such as simple views or impressions, are generally excluded from engagement calculations because they represent exposure rather than active participation.
To maintain a clean dataset, marketers must understand what "counts" on each platform:
- Instagram: Likes, comments, saves, and shares.
- TikTok: Likes, comments, shares, and saves on video content.
- LinkedIn: Reactions, comments, and shares.
- X (formerly Twitter): Likes, replies, and reposts.
The Six Essential Formulas for Calculating Success
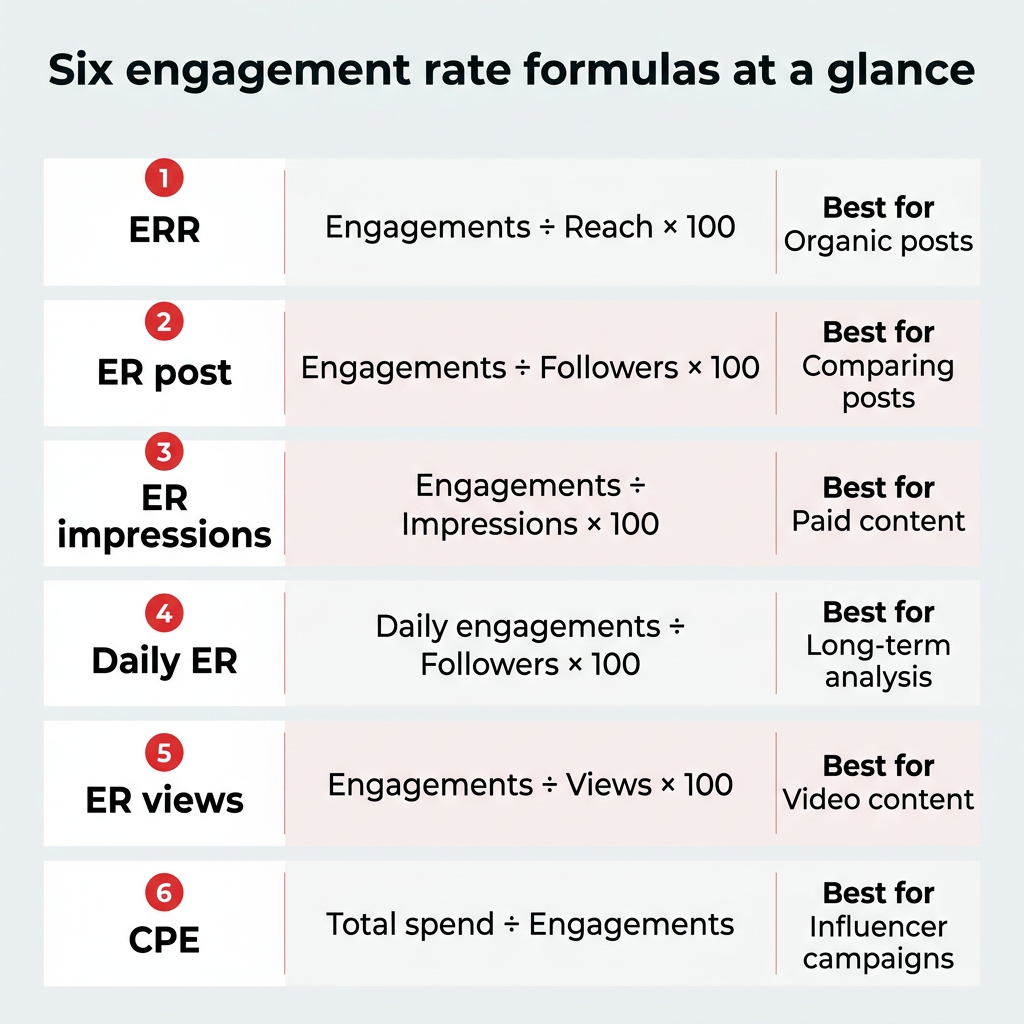
One size does not fit all in analytics. Depending on your objective—whether you are auditing an influencer’s potential or analyzing the success of a paid ad campaign—you must select the correct denominator.
1. Engagement Rate by Reach (ERR)
This is the industry standard for organic content. It calculates the percentage of people who, having seen your post, chose to interact with it.

- Formula: (Total Engagements / Reach) * 100
- Best Use: Measuring content resonance with the actual audience that viewed it.
2. Engagement Rate by Post (ER Post)
This provides a stable baseline by comparing interactions against your total follower count.
- Formula: (Total Engagements / Total Followers) * 100
- Best Use: Comparing individual post performance over time, regardless of fluctuations in algorithmic reach.
3. Engagement Rate by Impressions (ER Impressions)
For paid campaigns, this is the most transparent metric. Since impressions track every time a post hits a screen, it provides a realistic look at how often a single, repeated exposure leads to action.
- Formula: (Total Engagements / Total Impressions) * 100
- Best Use: Analyzing the efficacy of paid advertisements or CPM-based campaigns.
4. Daily Engagement Rate (Daily ER)
This captures the pulse of your account on an average day, accounting for activity on older posts that continue to gain traction.
- Formula: (Total Daily Engagements / Total Followers) * 100
- Best Use: Long-term trend analysis.
5. Engagement Rate by Views (ER Views)
Specific to video platforms like TikTok or Instagram Reels, where the "view" is the primary unit of distribution.
- Formula: (Total Engagements / Total Video Views) * 100
- Best Use: Assessing the "stickiness" of video content.
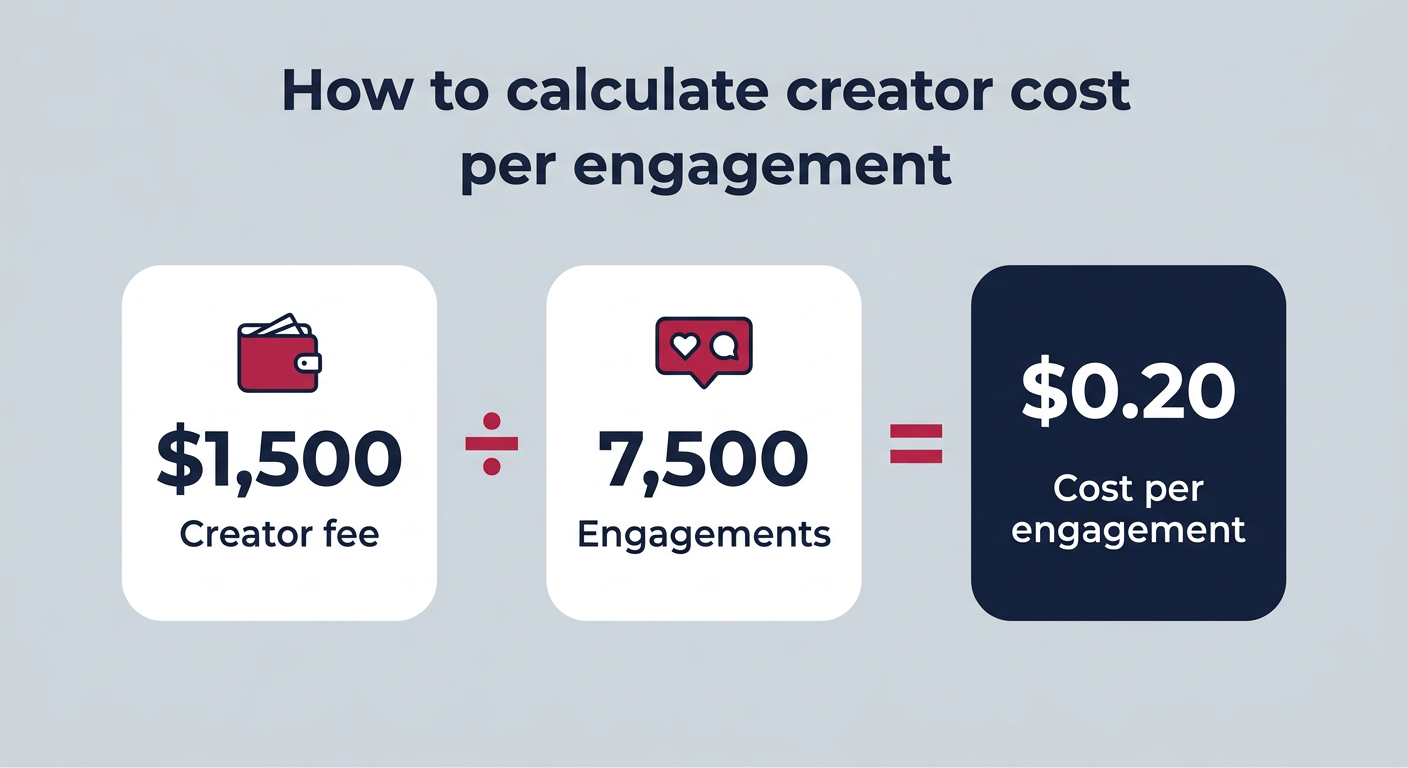
6. Cost Per Engagement (CPE)
In an era where influencer marketing spending has surpassed $10 billion annually, CPE is the ultimate efficiency metric.
- Formula: (Total Spend / Total Engagements)
- Best Use: Evaluating ROI for creator partnerships.
Benchmarking for 2026: What is "Good"?
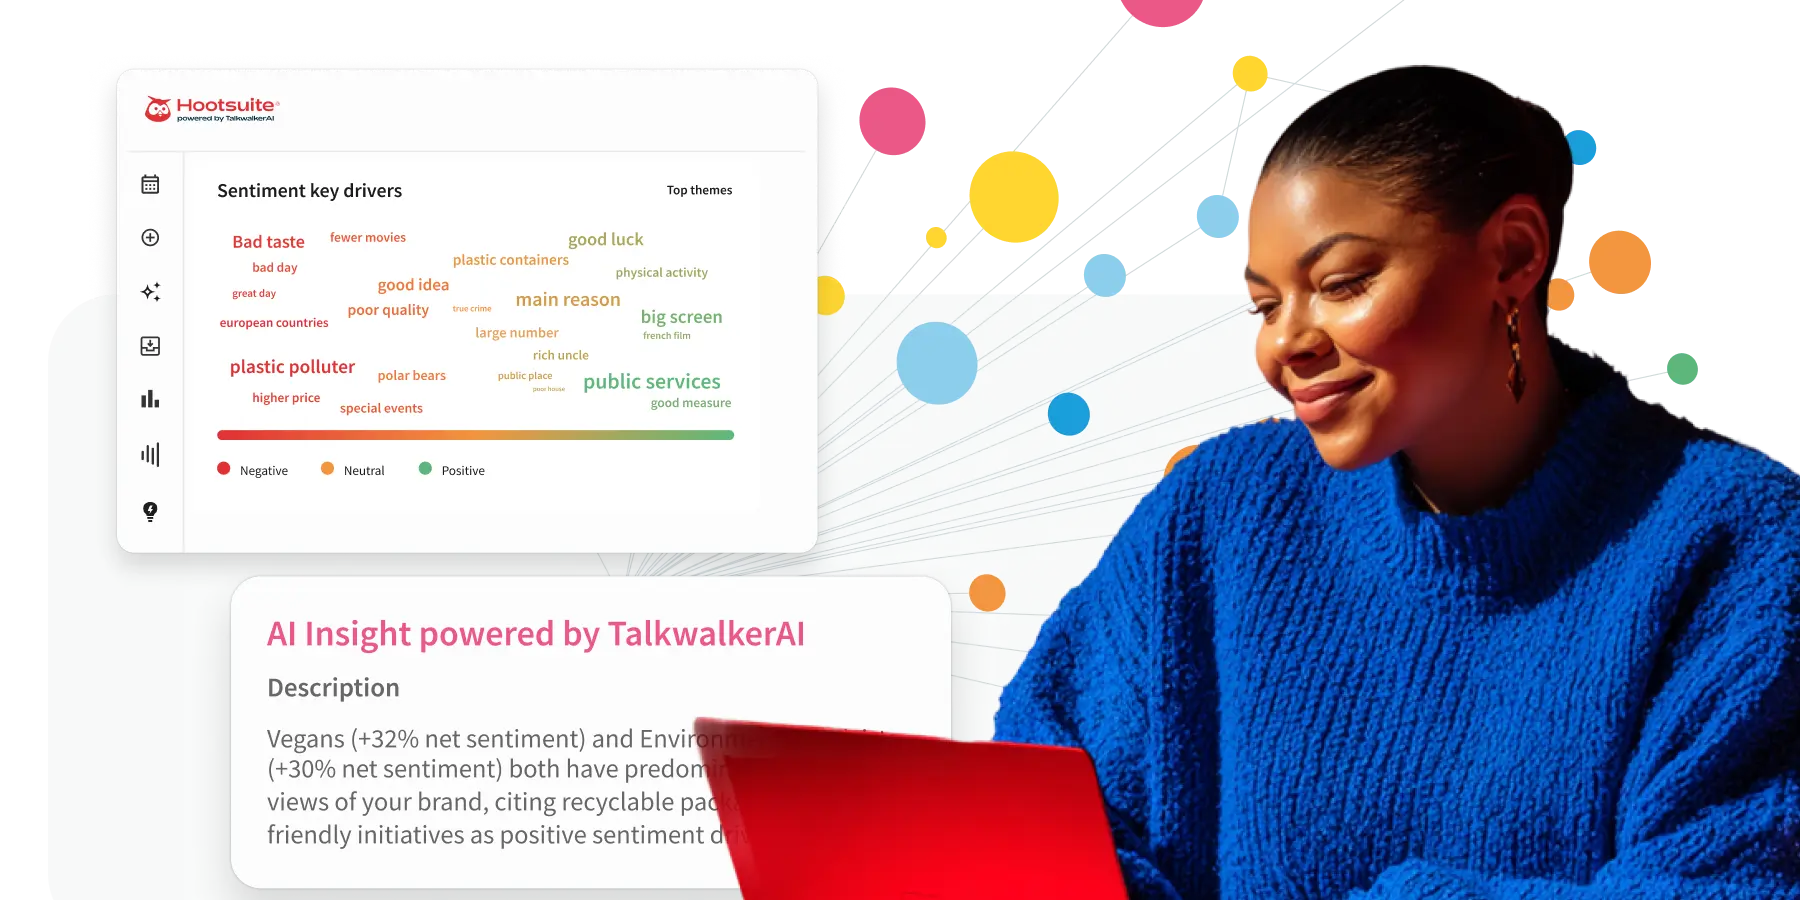
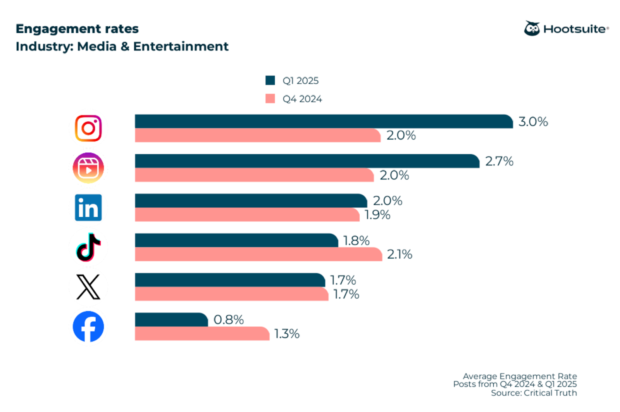
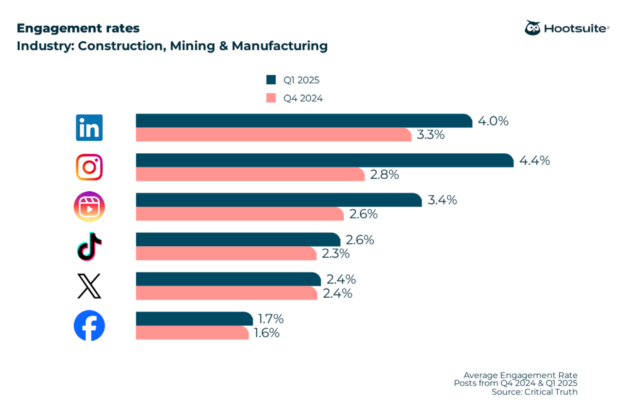
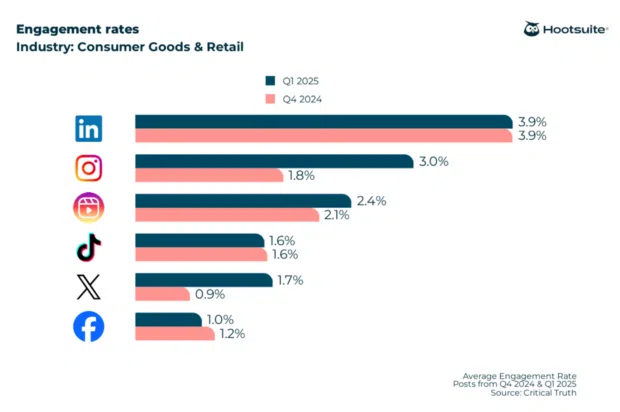
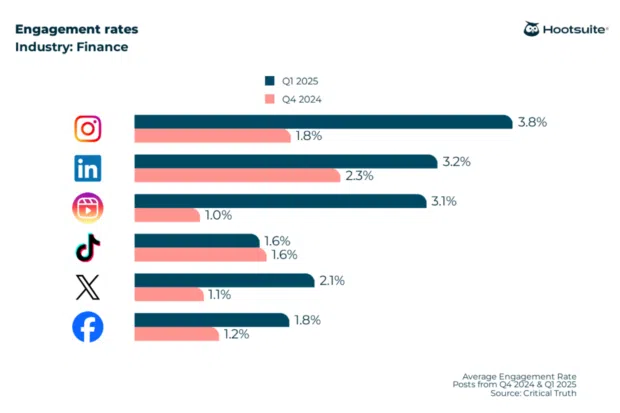
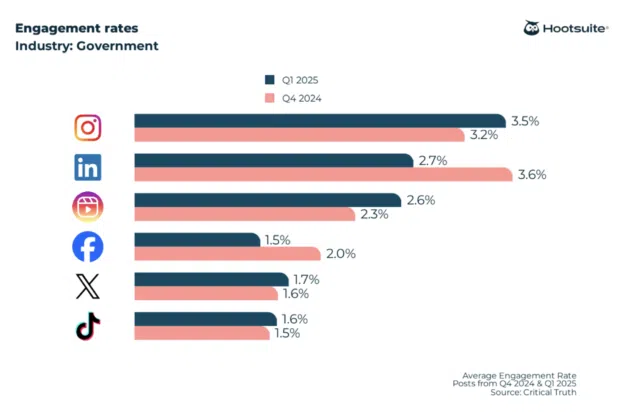
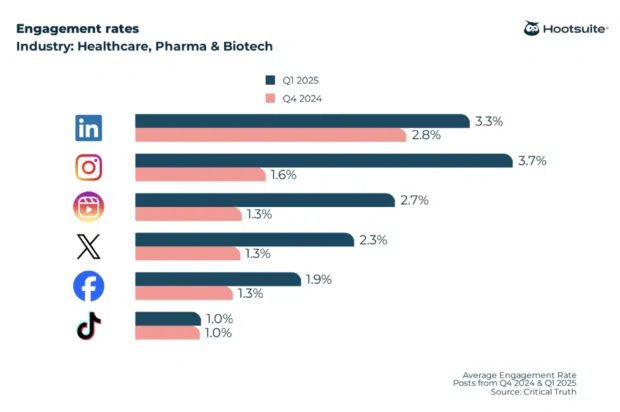
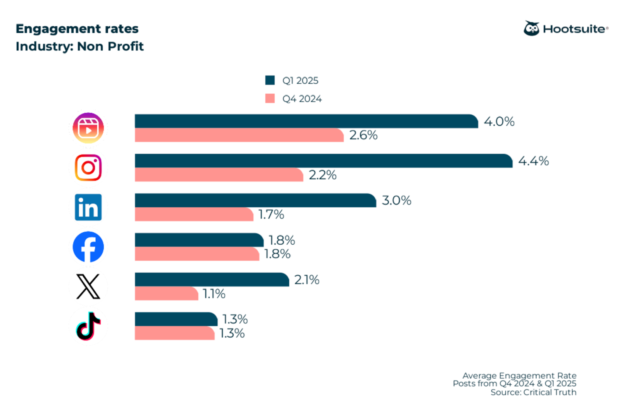
While a "good" engagement rate generally hovers between 1% and 5%, these figures are highly contextual. In 2026, Hootsuite’s industry data reveals significant variance based on sector and platform.
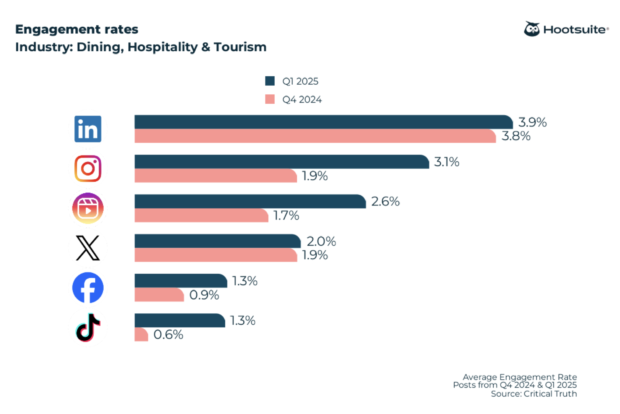
- Nonprofits: Leading the pack on Instagram, nonprofits often see engagement rates as high as 5.5% due to the emotional and mission-driven nature of their content.
- Construction & Manufacturing: These industries excel on LinkedIn, with rates reaching 5.2% on Instagram, proving that even "dry" industries can thrive with the right visual strategy.
- Healthcare & Biotech: Facing the strictest regulatory environments, these sectors often see lower engagement on platforms like TikTok (approx. 1%), highlighting the difficulty of creating "informal" content under compliance constraints.
Common Pitfalls: Why Your Data Might Be Misleading
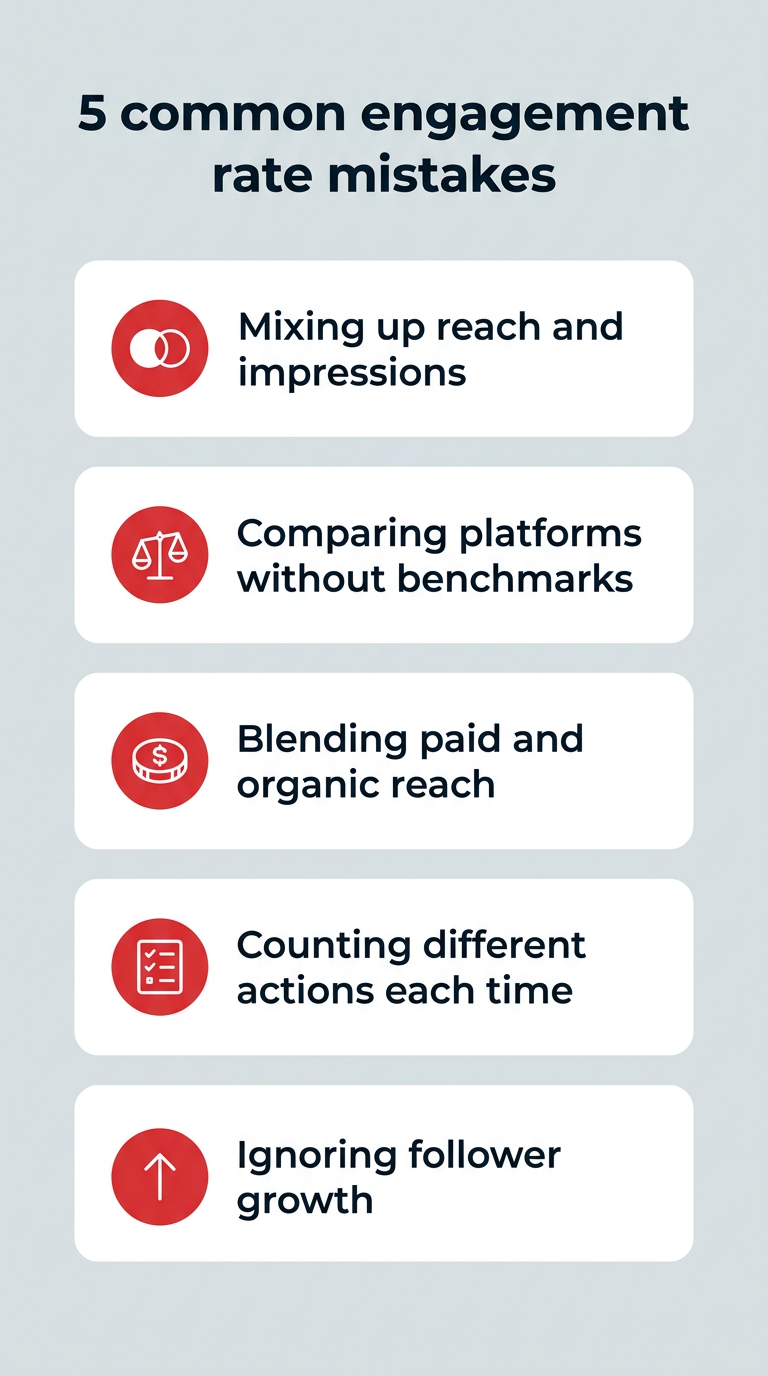
Before reporting your findings to leadership, audit your methodology for these five common mistakes:
- Inconsistent Inputs: Mixing and matching metrics (e.g., comparing Reach-based rates with Follower-based rates).
- Ignoring Platform-Specific Definitions: Assuming a "share" means the same thing on TikTok as it does on LinkedIn.
- Bot/Fake Follower Inflation: Relying on follower-based formulas when your audience includes non-human accounts.
- Neglecting Temporal Context: Comparing a viral post’s engagement to a standard weekly update.
- Excluding Paid/Organic Blending: Failing to segment paid ad performance from organic community building.
Implications for Future Strategy
Engagement rate is not just a number to be filed away; it is a diagnostic tool for your future content calendar.
If your engagement is low:
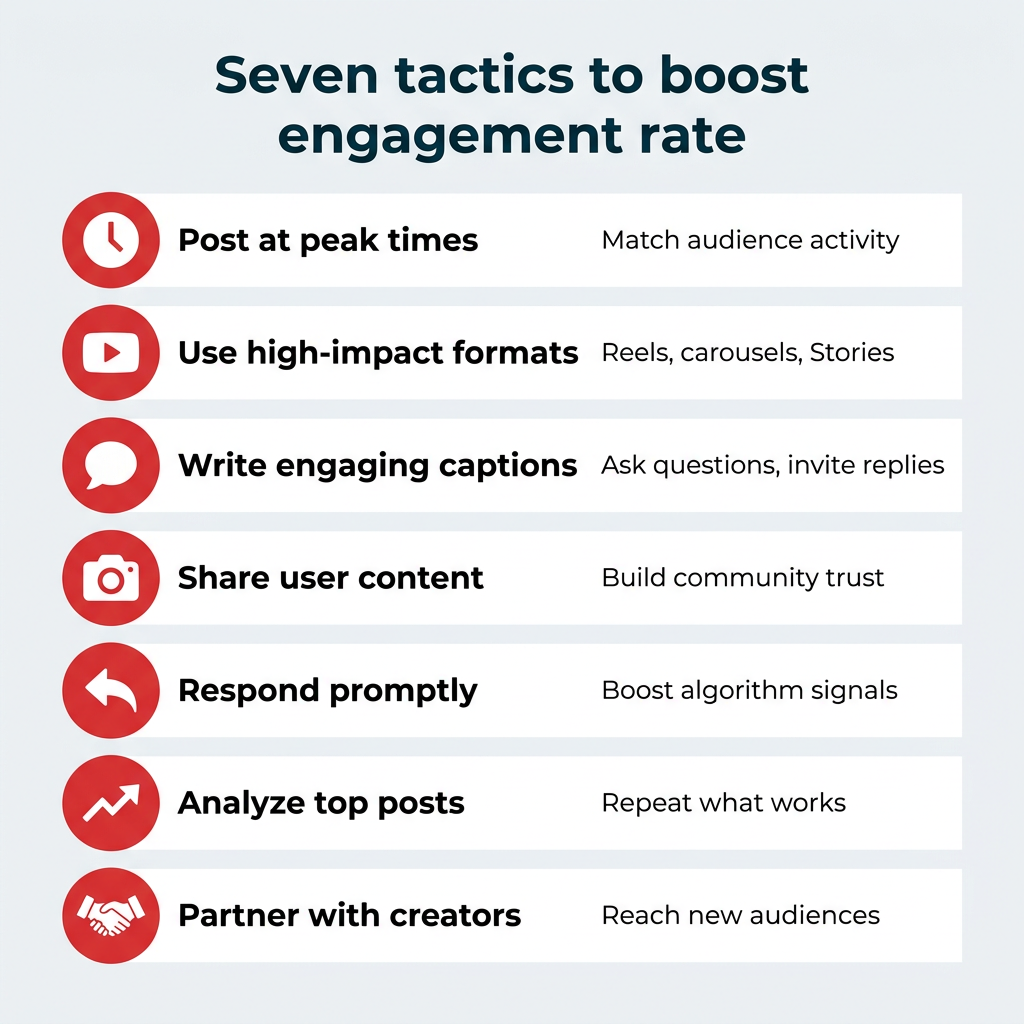
- Audit your format: Are you relying on static images when your audience prefers carousels or short-form video?
- Check your timing: Are you posting during your audience’s peak active hours?
- Community interaction: Are you treating social media as a broadcast channel or a two-way conversation? Responding to comments is the single fastest way to boost visibility.
If your engagement is high:
- Double down: Use your analytics dashboard to identify the specific topics, colors, or tones that resonated and build a content pillar around them.
- Scale: Use your high-performing organic posts as the creative for your next paid advertising campaign.
Conclusion: Turning Metrics into Meaning
As we navigate the latter half of the 2020s, the role of the social media manager has shifted from a "poster" to a "data-driven community architect." Engagement rate is the pulse of that community. By moving away from vanity metrics and focusing on the science of how your audience interacts with your brand, you transition from simply making noise to driving real, measurable business impact.
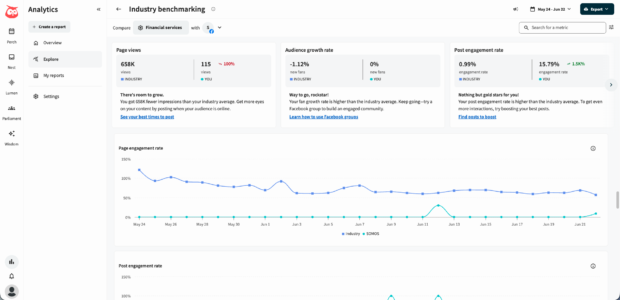
For enterprise teams, the use of automated analytics tools—such as those integrated into the Hootsuite dashboard—is no longer a luxury; it is a necessity. By removing the manual labor of spreadsheet-based calculations, teams can spend less time crunching numbers and more time executing the creative strategies that actually move the needle. Remember, your engagement rate is a reflection of your relationship with your audience. Invest in the metrics, and the community will follow.