In the rapidly shifting landscape of digital marketing, the ability to discern between vanity metrics—like sheer follower counts—and meaningful interaction is the primary differentiator between brands that grow and those that stagnate. As we head into 2026, the data confirms a persistent truth: social media is no longer just a broadcast channel; it is a conversation.

To help marketers navigate this complexity, we have analyzed performance across 13 industries, providing a comprehensive look at what constitutes "success" on Instagram, LinkedIn, Facebook, X (Twitter), and TikTok. This report serves as your definitive guide to understanding engagement, benchmarking your performance, and optimizing your strategy for the year ahead.

What is Engagement Rate and Why Does It Matter?
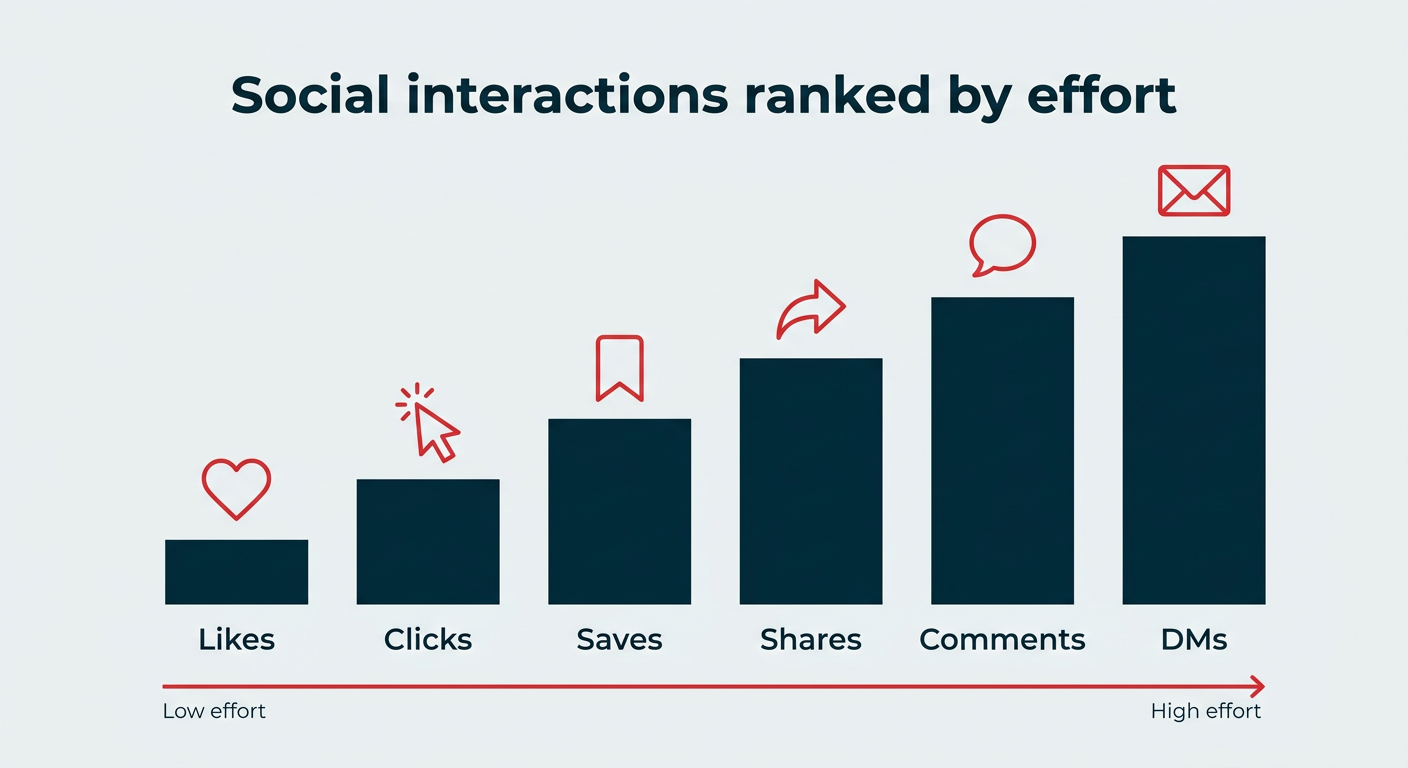
At its core, engagement rate is the pulse of your social media presence. It measures the percentage of your audience that moves beyond passive consumption—scrolling past your post—and chooses to interact with it.
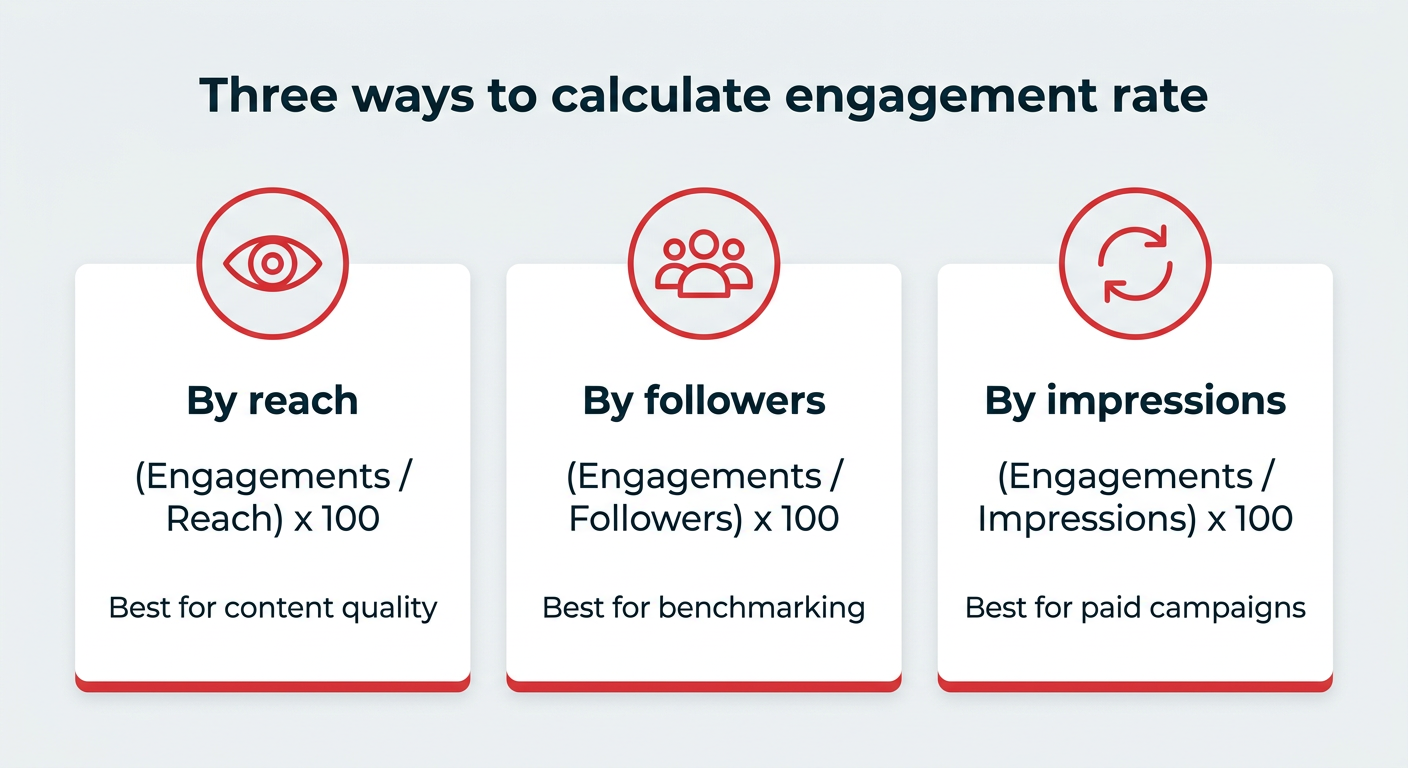
The calculation is straightforward: (Total Engagements / Audience Size) x 100. Depending on your specific goals, "audience size" can be defined by your follower count, your total reach, or your total impressions. While follower-based engagement is the industry standard for benchmarking, reach-based engagement provides a more granular look at the quality of your content relative to those who actually viewed it.
Why Engagement Trumps Exposure
For marketing leaders, engagement is the ultimate indicator of resonance. While impressions measure potential exposure, engagement measures genuine response. Tracking this metric serves four critical business functions:
- Validation of Strategy: It proves whether your content pillars align with audience interests.
- Algorithm Optimization: Higher engagement signals to platform algorithms that your content is valuable, leading to increased organic distribution.
- Community Sentiment: Comments, shares, and saves act as qualitative feedback loops for product development.
- Benchmarking Performance: It allows brands to compare their ROI against competitors, regardless of account size.
Chronology of Social Media Metrics: From Reach to Resonance
The evolution of social media marketing has followed a clear trajectory. In the early 2010s, the "Reach Era" dominated, where brands prioritized accumulating the largest possible follower base. During this period, success was defined by the size of the megaphone.
By the late 2010s, platforms began to adjust their algorithms to prioritize "meaningful social interactions." This shift forced a pivot toward the "Connection Era." In 2026, we have firmly entered the "Resonance Era." In this environment, reach is no longer a metric of success if it is not accompanied by intent. Algorithms now prioritize saves, shares, and high-quality comments, effectively penalizing brands that produce "scroll-bait" content that lacks substance.
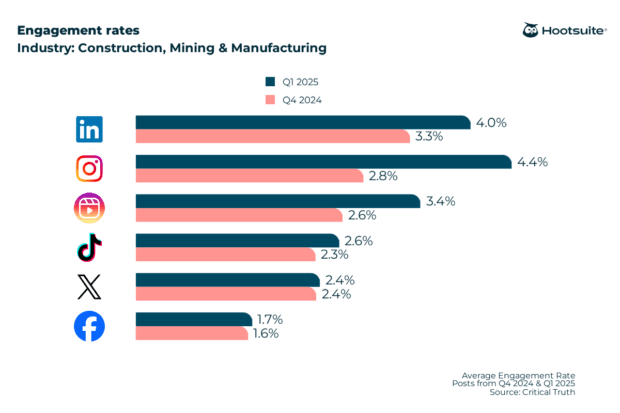
Supporting Data: Benchmarks by Platform and Sector
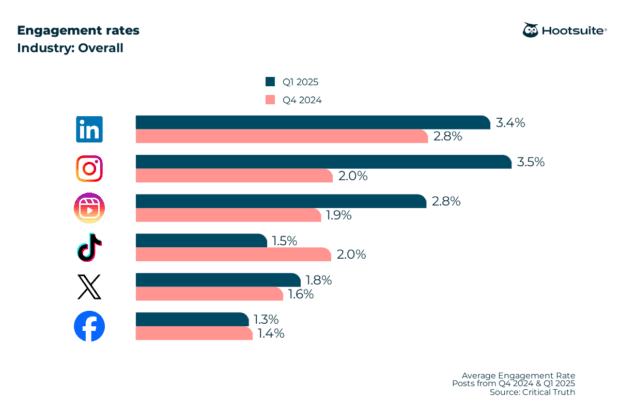
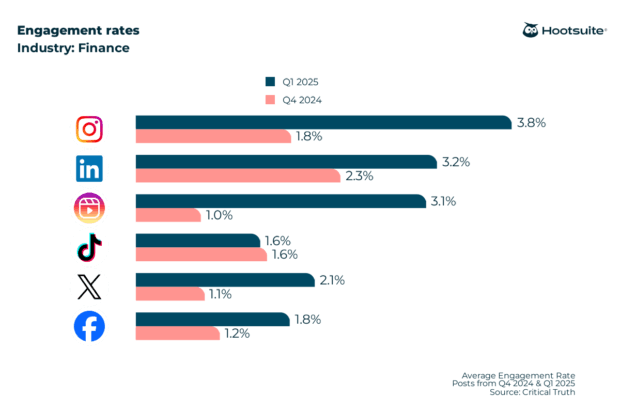
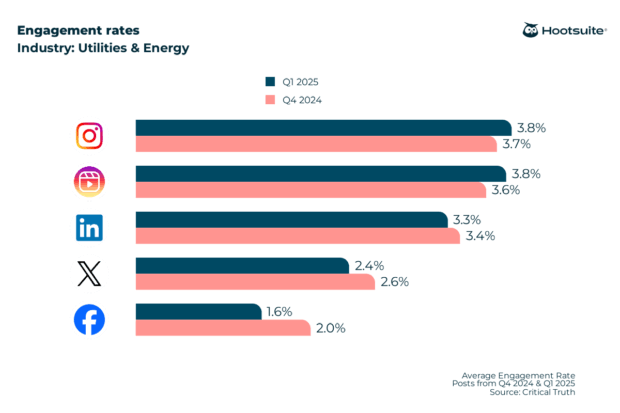
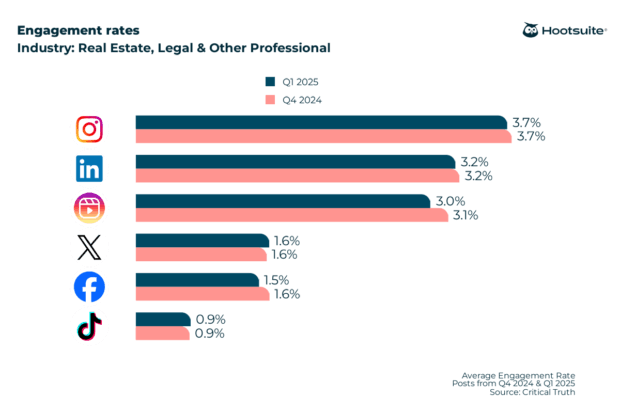
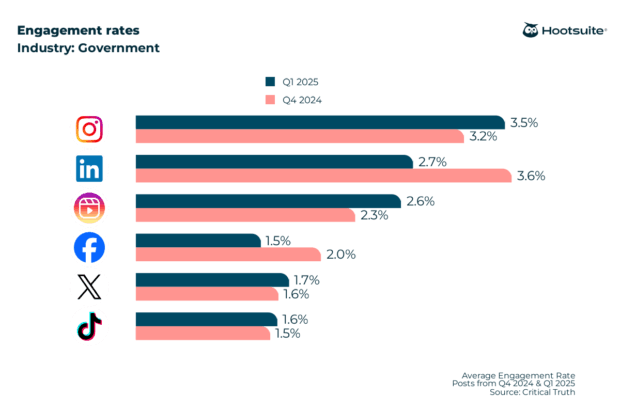
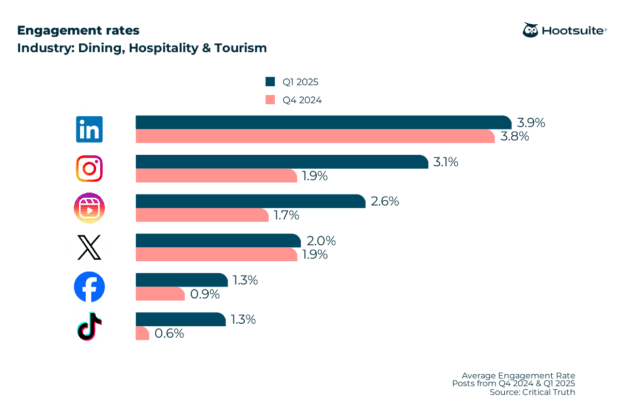
The 2026 data indicates a wide variance in performance based on both the industry and the chosen platform. While Instagram remains the engagement powerhouse, LinkedIn has seen a significant surge, proving that professional audiences are becoming increasingly active.
Overall Platform Performance
| Platform | Average Engagement Rate |
|---|---|
| 4.2% | |
| 3.9% | |
| 2.9% | |
| X (Twitter) | 1.8% |
| TikTok | 1.5% |
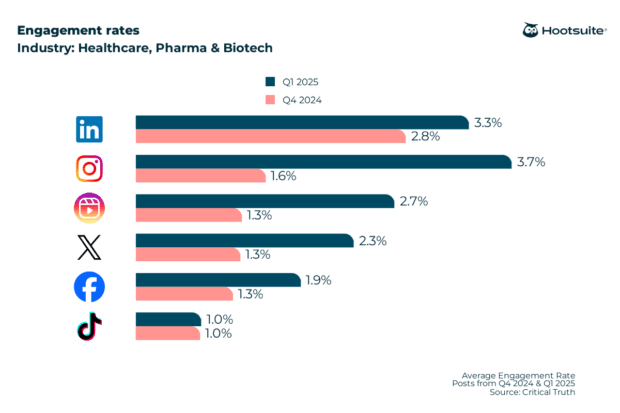
Industry Highlights
- Construction & Manufacturing: Leads on TikTok (2.6%) due to the "process-driven" nature of the content.
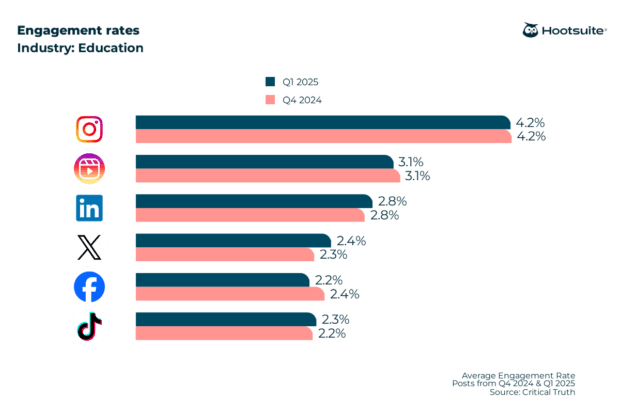
- Education: Holds the highest engagement on Facebook (5.2%), driven by tightly-knit communities of alumni and parents.
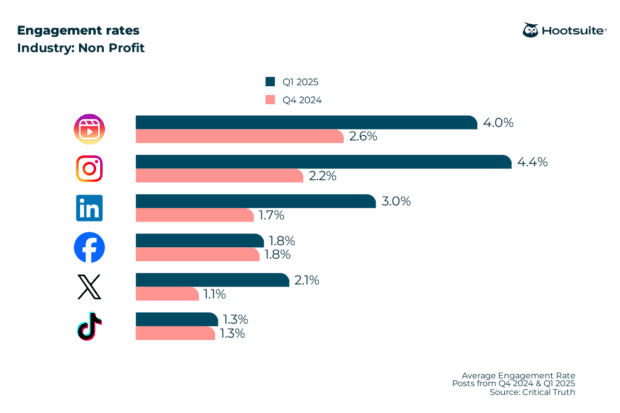
- Nonprofits: Dominates Instagram (5.5%), proving that mission-driven storytelling is the most effective currency for engagement.
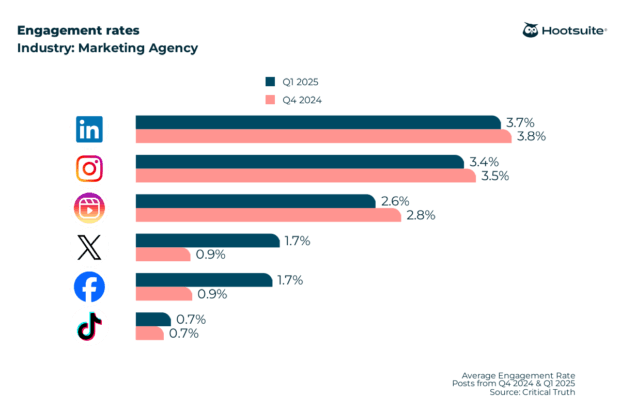
- Marketing Agencies: Finds their home on LinkedIn (4.7%), where professional authority and B2B networking drive high interaction.
Expert Analysis: The "Fit" Factor
Marketing professionals often ask, "Is a 12% engagement rate good?" The answer is unequivocally yes—it is exceptional. However, context is vital. Smaller, niche accounts often naturally report higher engagement rates than global brands with millions of followers.
"The most common mistake we see is brands comparing their engagement against a generic, platform-wide average," says Karolina Mikolajczyk, an expert in digital marketing strategy. "A 2% engagement rate on TikTok might be considered a ‘strong’ result, whereas that same number on Instagram would signal a struggling account. You must measure your performance against your industry peers and your own historical baseline."
The "TikTok Paradox"
A point of contention in the 2026 data is the lower-than-expected engagement rate on TikTok (1.5%). While the platform is the most popular for discovery, its recommendation engine serves content to non-followers who may not have an existing affinity for the brand. Consequently, while TikTok is excellent for reach, it often dilutes engagement rates compared to the "follow-based" feeds of Instagram or LinkedIn.
Implications for 2026 Strategy
As we move through the remainder of the year, organizations should adjust their tactics to prioritize these findings:
1. Shift from Quantity to Quality
The "always-on" posting schedule is dead. Data shows that publishing fewer, higher-quality posts leads to better algorithmic favorability than cluttering feeds with mediocre content. Focus on deep-dive, high-value assets rather than filler posts.
2. The Rise of "Saveable" Content
The algorithm has clearly indicated its preference for "saves" and "shares." To optimize for this, brands should focus on educational, actionable, and visually arresting content. Whether it is a carousel explaining a complex concept (for LinkedIn/Instagram) or a tutorial video, the goal is to create content that users want to keep for later.
3. LinkedIn as a Primary Channel
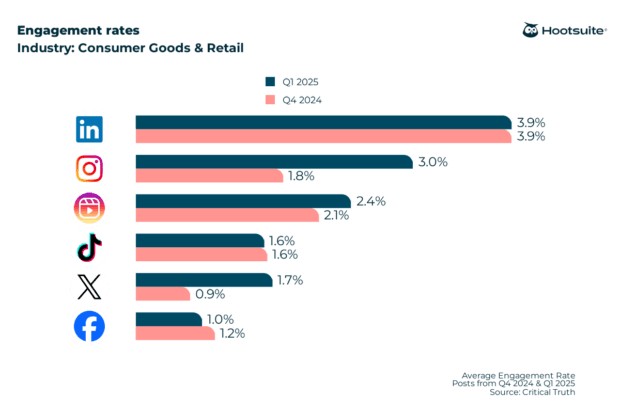
B2B brands that have sidelined LinkedIn in favor of "trendier" platforms are missing out. With an engagement rate of 3.9%, LinkedIn is essentially on par with Instagram. It is the premier space for thought leadership, and for many sectors—especially retail and professional services—it is outperforming B2C channels.
4. Facebook: A Paid and Community Play
Organic reach for retail and tech brands on Facebook continues to hover below 2%. If your business relies on Facebook, treat it as a community management tool (Groups) or a paid distribution channel. Do not rely on organic posts to drive mass awareness.
5. Embracing the 50/30/20 Rule
For those struggling to balance their content mix, we recommend the 50/30/20 framework:
- 50% Engagement: Content designed to start conversations, ask questions, or provide pure entertainment.
- 30% Education: Value-driven posts, how-tos, and industry insights.
- 20% Promotion: Direct calls to action, product launches, and sales-focused content.
Final Thoughts: The Road Ahead
Engagement is not just a metric; it is a signal of brand health. In 2026, the brands that win will be those that stop chasing the algorithm and start serving the human.
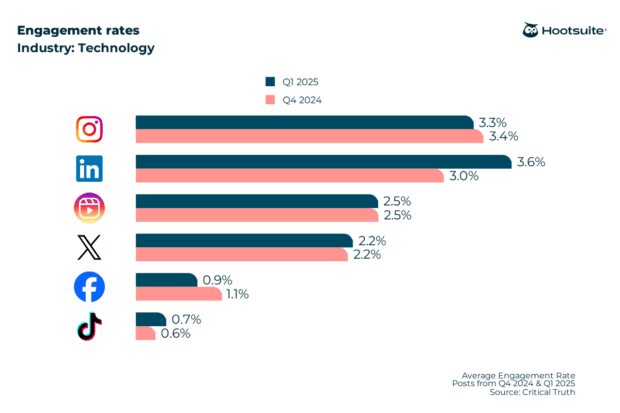
By analyzing your engagement rates by industry and platform, you can stop guessing what works and start building a strategy based on data-backed reality. Use our free engagement calculator to establish your baseline today, and remember: if your audience is interacting, you are already ahead of the curve.
For more in-depth analytics, scheduling tools, and trend discovery, visit the Hootsuite dashboard to streamline your social media operations and turn conversations into conversions.