In the modern digital ecosystem, social media teams sit on a goldmine of information. Every day, they capture the freshest, most unfiltered reactions from the world’s largest focus group. Engagement metrics are rising, brand mentions are spiking, and sentiment analysis is trending positive. Yet, a persistent paradox remains: despite this abundance of raw intelligence, many organizations struggle to translate these signals into tangible business outcomes.
According to the 2026 Social Intelligence Report, a staggering 64% of organizations fail to use social insights to inform decisions outside of the marketing department. The data remains trapped in dashboards, serving as vanity metrics rather than strategic drivers. This is no longer just a technical hurdle; it has become a profound storytelling crisis. To bridge the gap between social metrics and executive decision-making, teams must evolve from data reporters into data storytellers.
The Anatomy of the Data Problem
The core issue is that raw data is inherently silent. A spreadsheet of engagement rates or a list of hashtags provides the "what," but it rarely explains the "why" or the "so what." When social teams present data without a narrative, they force non-marketing stakeholders—such as product managers, sales leads, or C-suite executives—to do the heavy lifting of interpretation.
Most executives prioritize quantitative data that maps directly to the bottom line. When a social team presents a graph without context, the executive sees a line on a chart; they do not see the opportunity for a product pivot or a shift in retention strategy. By failing to construct a narrative, social teams inadvertently relegate themselves to a silo, ensuring that their most valuable insights are viewed as "nice to have" rather than "need to know."

Defining Data Storytelling: The Bridge Between Insight and Action
Data storytelling is the strategic fusion of data science, narrative structure, and visual communication. It is the practice of translating complex, often overwhelming datasets into a coherent, compelling arc that demands action.
Unlike standard reporting, which acts as a historical record, data storytelling is prospective. It uses the past to predict the future and uses evidence to justify a specific recommendation. Social media is uniquely positioned for this because it offers market intelligence that other sources cannot replicate. While CRM records and support tickets track customers who are already deep in the conversion funnel, social media captures the "unprompted take"—the raw, live, and often brutal feedback that occurs before a customer even interacts with a brand’s official channels.
The High Cost of Siloed Intelligence
The consequences of poor data storytelling are measurable. Research suggests that 86% of organizations have missed significant business opportunities in the last two years because social insights were either delayed, siloed, or improperly communicated.
This is a governance failure. When an insight is not shaped into a narrative that a decision-maker can understand, it dies on the vine. Whether it is a wave of confusion regarding a pricing update or a grassroots movement demanding a new feature, these signals represent vital business intelligence. When they are not effectively communicated, the company operates in a vacuum, ignoring the very voices that hold the key to competitive advantage.
Building the Narrative: A Framework for Impact
To transform a dry report into a narrative that sticks, social teams must treat their data like a screenplay. The following framework serves as a guide for building a story that travels through the organization.
1. Know Your Audience
Before selecting a single data point, identify who the story is for. An executive, a product developer, and a customer success lead care about different metrics. If you are speaking to the C-suite, focus on how social signals correlate with pipeline, revenue, or brand risk. If you are speaking to the product team, focus on feature-specific feedback and user sentiment. Tailoring the language is not "spinning" the data; it is making the data relevant to the recipient’s goals.
2. The Narrative Arc: Setting the Scene
A memorable data story follows the classic narrative structure:
- The Status Quo: Start with the current environment.
- The Catalyst: Introduce the change or the anomaly in the data.
- The Conflict: Explain the friction or the opportunity (the "why").
- The Resolution: Offer the recommendation and the expected impact.
By presenting data in this arc, you move the audience from a state of passive listening to active engagement. They remember the story because it follows a logical, emotional, and intellectual path.
3. Contextualization: Pairing Qualitative with Quantitative
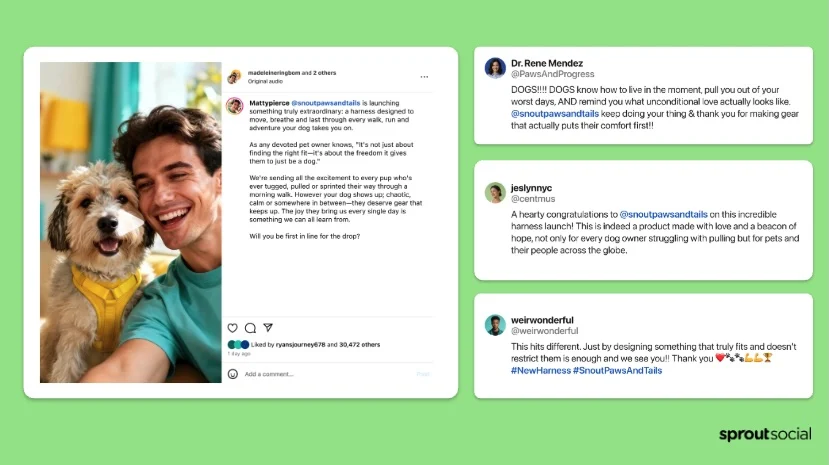
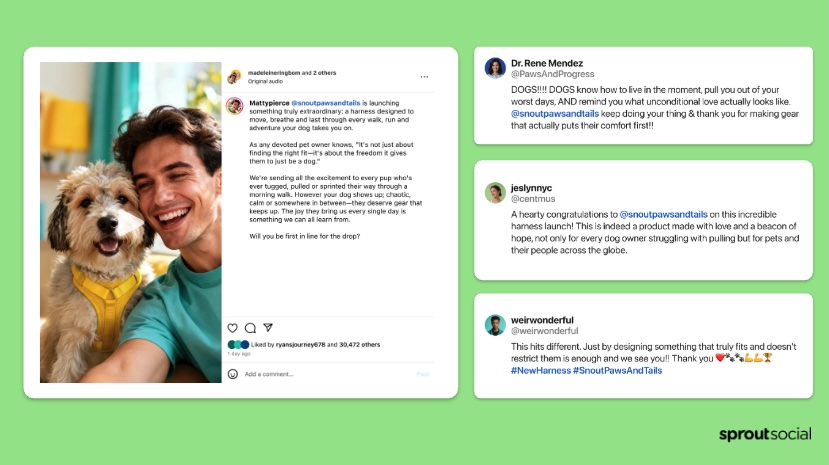
Numbers without context lead to misinformation. If social engagement spikes, is it due to a viral campaign or a PR crisis? Quantitative data provides the scale, but qualitative data—the actual comments, screenshots, and customer anecdotes—provides the soul. When you pair a chart showing a spike in sentiment with a verbatim quote from a customer, you turn a mathematical observation into a human experience.
4. Visualizing with Intent
Visualization should be the "easy button" for your audience. Avoid cluttered charts. Use visuals that emphasize the specific point you are trying to make. If you want to show a correlation, overlay the two datasets clearly. If you are highlighting a specific trend, use color and annotation to draw the eye exactly where you want it to land. Every element on the slide must justify its existence.
A Step-by-Step Execution Strategy
To master the art of the presentation, follow this tactical approach:
- Curate the Points: Do not present everything. Select the data that best supports your central argument.
- Lead with the Second-Most Interesting Point: Hook your audience early. By presenting a strong, unexpected data point, you command their attention immediately.
- The Visual Reveal: Use visual aids to support your verbal narrative. As you speak, the data should appear on screen to validate your claims.
- Anticipate the "So What?": Acknowledge potential objections. If you know they will ask about causation versus correlation, address it preemptively. This builds credibility.
- The Climax: Save your strongest piece of evidence for the end. This is your "aha!" moment that leaves a lasting impression.
- The "So What" Resolution: Conclude with a clear recommendation. Do not leave the audience to guess what happens next. Tell them exactly how this insight should change the business strategy.
Examples of Excellence
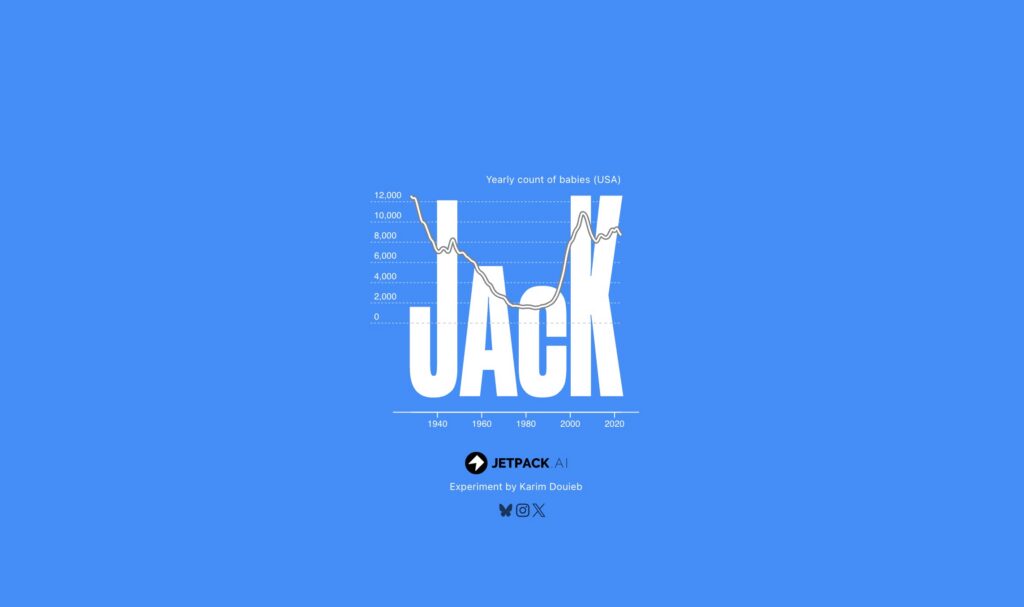
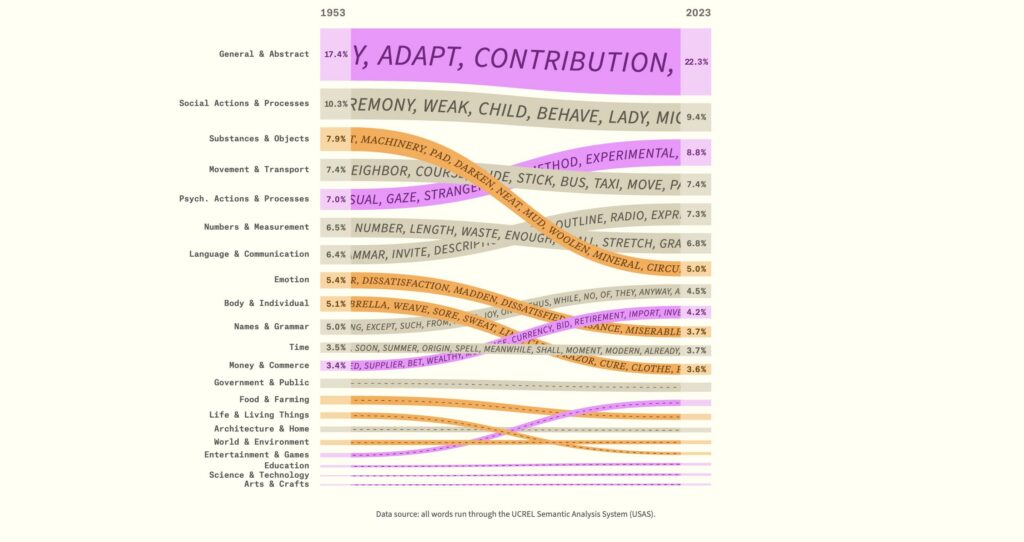
Several organizations and platforms have set the standard for how data can be presented. Jetpack AI utilizes simple, interactive visualizations to make demographic data accessible and engaging. The Pudding is the gold standard for data journalism, consistently proving that even complex topics can be made intuitive through smart visual storytelling. Similarly, industry leaders like Sprout Social incorporate these principles into their reporting, showing that the best insights are those that suggest an immediate, logical action.
The Future of Organizational Intelligence
The ability to translate data into a story is no longer a "soft skill"—it is a critical business competency. As the volume of social data continues to explode, the competitive advantage will shift from those who possess the most data to those who can best explain what that data means.
When a social team masters the art of data storytelling, they stop being a support function and become a strategic partner. Their reports are no longer filed away in a digital folder; they are quoted in board meetings and referenced in product roadmaps.
To start your journey, focus on the "so what." Audit your current reports: do they just list metrics, or do they tell a story? If they lack a narrative, start by adding context, defining your audience, and building an arc. The data you have is powerful, but it only becomes valuable when it travels outside your team and informs the rest of the business. By mastering the narrative, you ensure that your social intelligence drives not just engagement, but real-world growth.