The recent bullish momentum that has defined Bitcoin’s performance throughout the latter half of 2026 is currently undergoing a rigorous stress test. While the foundational structural integrity of the premier cryptocurrency remains intact, a palpable shift in market sentiment is forcing investors and analysts alike to reassess the immediate trajectory. Recent data from crypto intelligence platforms indicates that the unbridled optimism that fueled recent rallies is waning, replaced by a climate of caution as the market grapples with profit-taking and cooling demand.
The State of the Market: A Sentiment Reversal
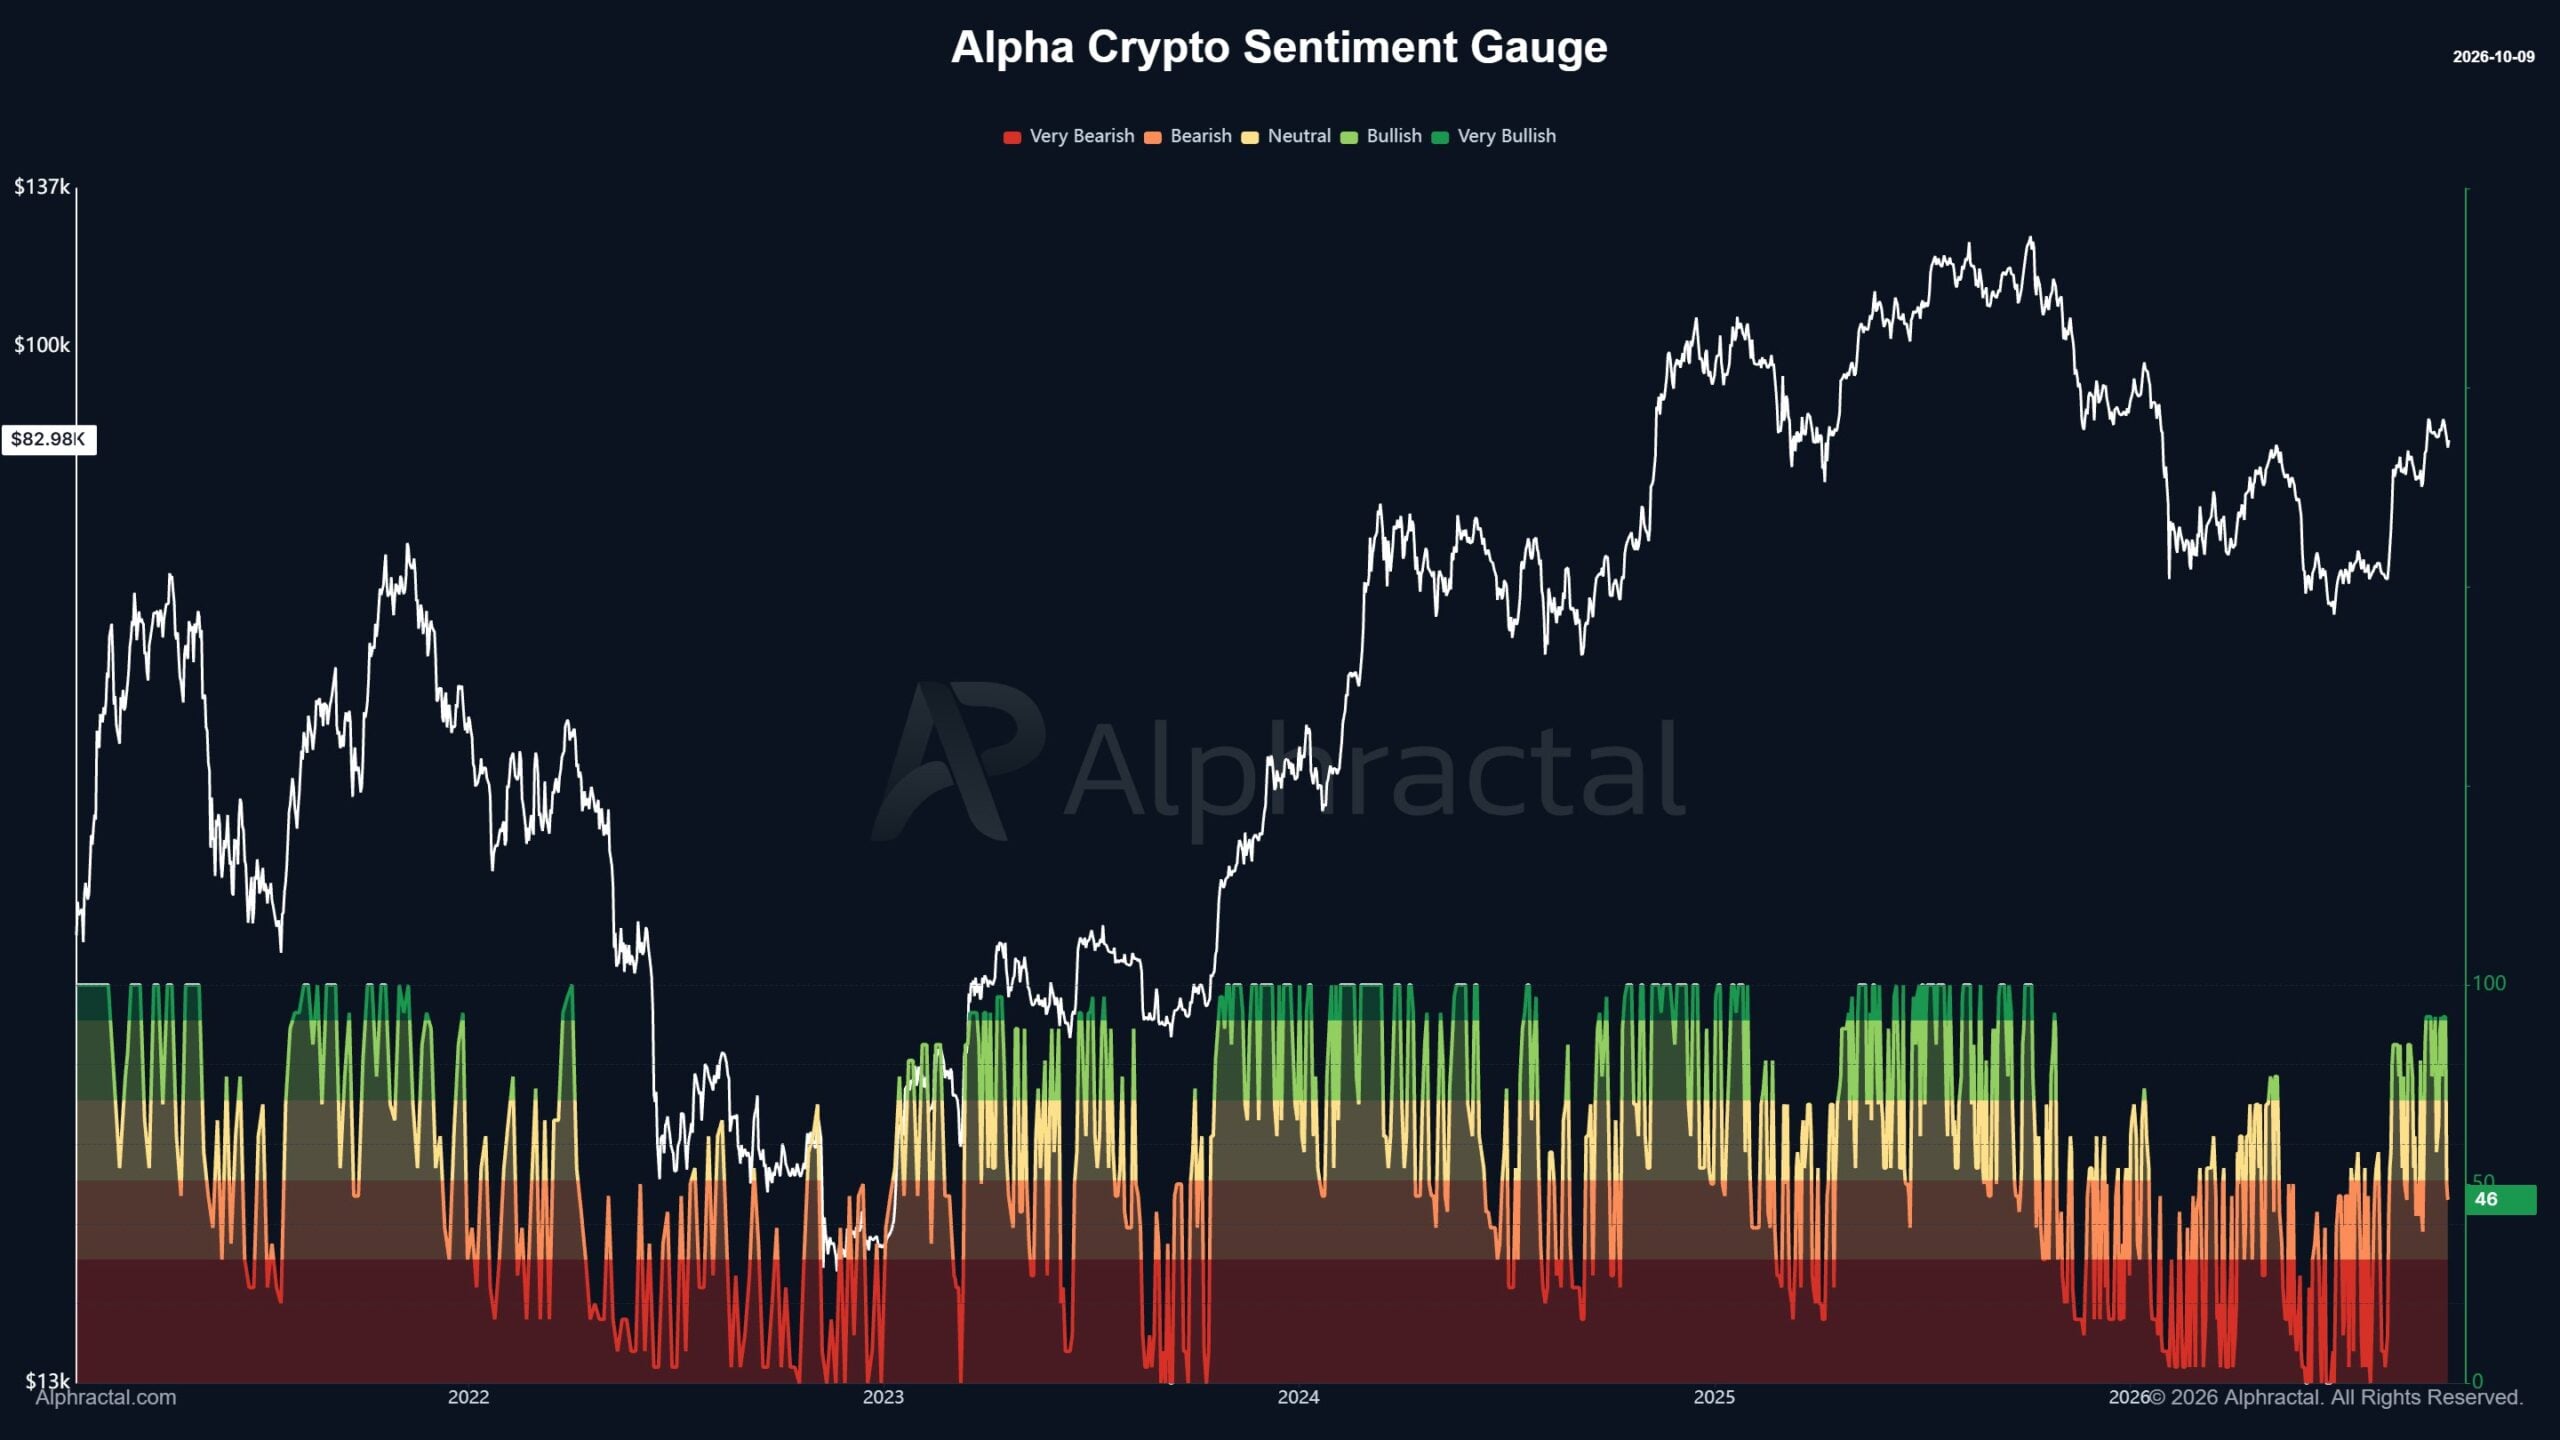
The crypto market, known for its rapid mood swings, is currently reflecting a more conservative outlook. According to data shared by the crypto intelligence platform Alphractal, the market’s "Sentiment Gauge" has officially dipped below the critical 50-point threshold. This decline follows a volatile correction earlier this month that saw prices oscillate violently.
This shift in sentiment is not happening in a vacuum. It is deeply tied to a massive wave of profit-taking. Recent analytics from Santiment revealed that Bitcoin holders realized a staggering $1.03 billion in profits recently—the second-largest wave of such activity seen in 2026. When market participants cash out on this scale, it often serves as a signal that the "easy money" phase of a rally may be concluding, forcing the market to find a new equilibrium based on genuine spot demand rather than speculative fervor.

Chronology of the Recent Correction
To understand where Bitcoin is heading, one must look at the timeline of its recent movements:
- Early October 2026: Bitcoin began testing the $84,000 resistance zone, with bullish sentiment peaking as analysts speculated on a breakout toward new record highs.
- Mid-October 2026: As the price approached these overhead supply levels, profit-taking surged. The realization of $1.03 billion in gains by long-term holders created immediate selling pressure.
- Late October 2026: The market witnessed a broader correction. Liquidation heatmaps began showing significant pressure points in the $83,600 to $85,000 range.
- Current Status: Sentiment has turned neutral-to-bearish, with the price consolidating around the $80,500 support level, a key psychological and technical benchmark.
Supporting Data: Liquidation Heatmaps and Onchain Metrics
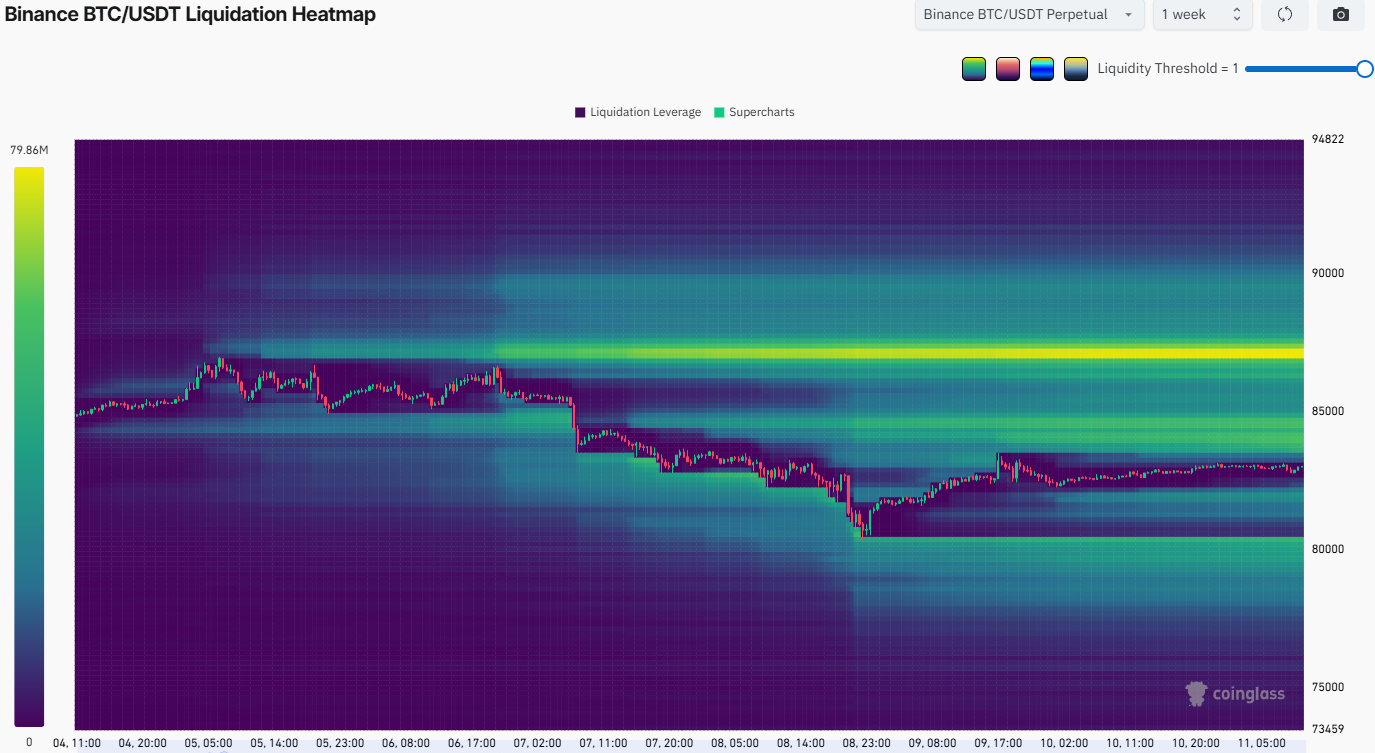
The structural challenges facing Bitcoin are best visualized through liquidation heatmaps, such as those provided by CoinGlass. These maps illustrate the concentration of leveraged positions. Currently, the $83,600–$85,000 zone acts as a "magnetic" liquidity cluster.
In technical analysis, a high density of liquidations in a specific price range often attracts the market. However, in the current environment of weakening spot demand, this "magnet" could prove to be a trap. Without a surge in fresh buying power—such as renewed institutional interest or sustained ETF inflows—a push into this liquidity zone might merely serve as a short squeeze. If the market fails to convert this liquidity into long-term support, the likelihood of a deeper correction falling below the $80,000 mark increases significantly.
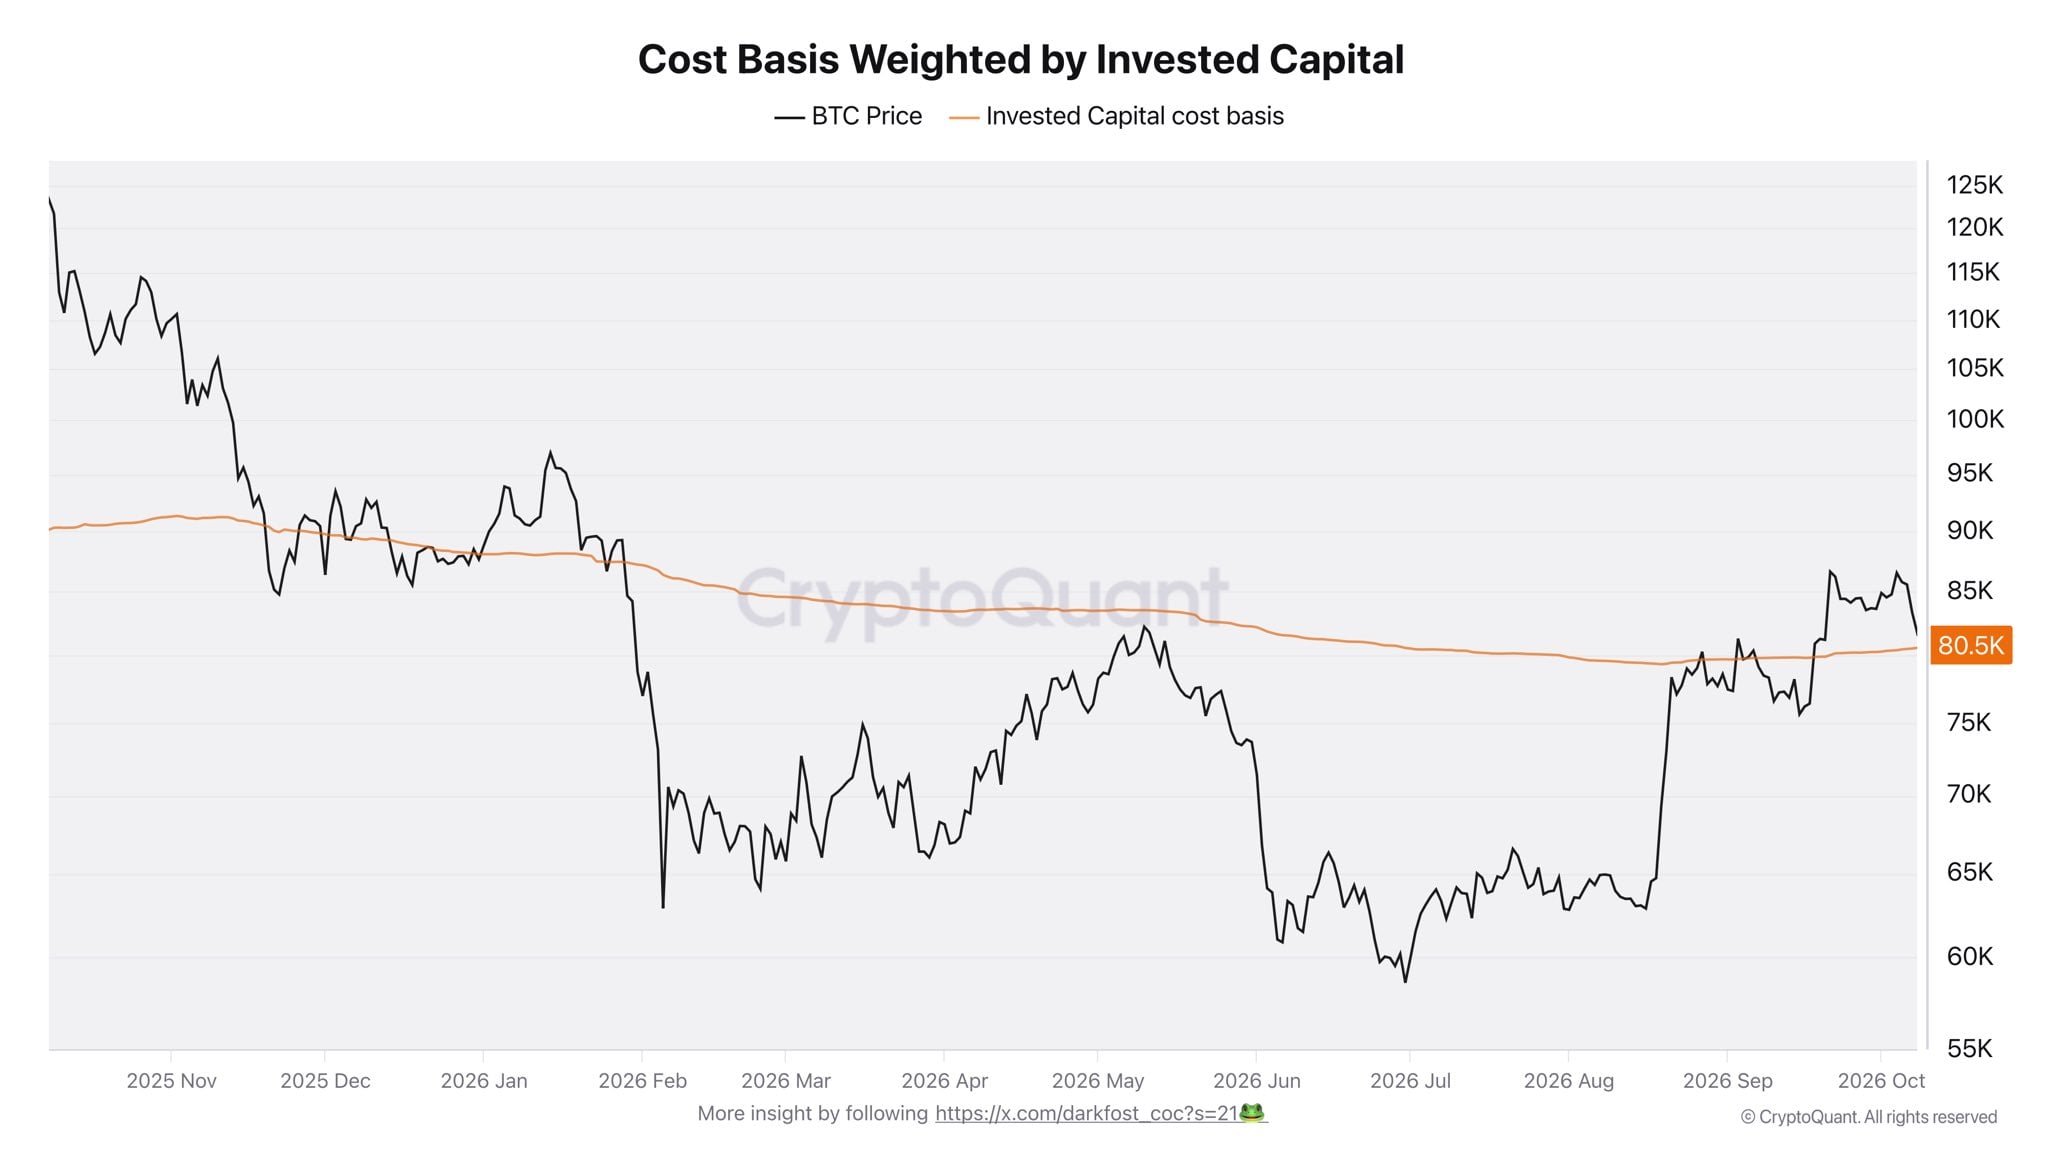
Furthermore, the "Cost Basis Weighted by Invested Capital" provides a clearer picture of investor sentiment than standard moving averages. Crypto analyst Darkfost has highlighted that $80,500 represents the crucial cost basis line. This metric is sophisticated because it adjusts for the volume of capital invested at different price points, rather than just the number of coins moved. At this level, the average market participant is essentially at the break-even point. Historically, as seen in the patterns of late 2025 and early 2026, the market tends to consolidate around this cost basis when it is searching for a bottom.
Expert Analysis: The Long/Short Dynamic
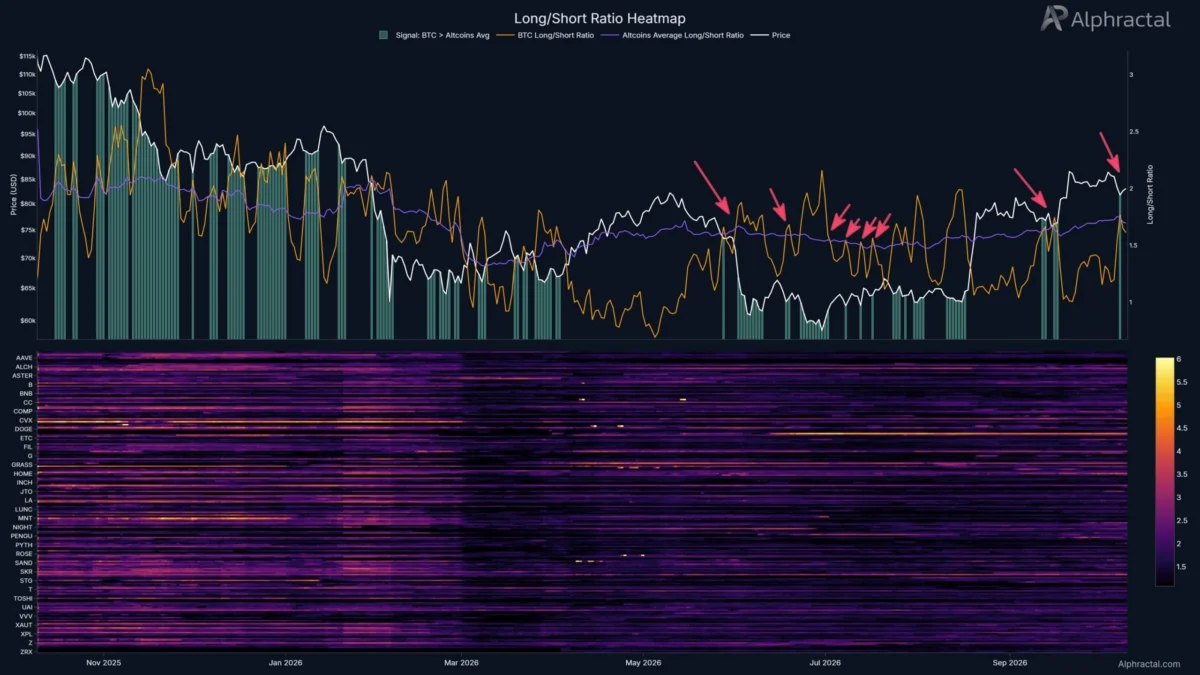
Adding a layer of complexity to the market structure is the Long/Short ratio. Analyst Joao Wedson has pointed to a potential silver lining amidst the current gloom. According to his observations, when the Bitcoin long/short ratio rises above the altcoin market’s corresponding ratio, it often signals that the "selling exhaustion" phase is near.
This specific divergence suggests that Bitcoin is attracting a different class of capital compared to the broader, often more volatile, altcoin market. When this ratio flips, it historically correlates with a stabilization of Bitcoin’s price. Consequently, while the immediate term is fraught with uncertainty, the $80,500 level is currently serving as the "floor" that is preventing a total collapse of the current bullish thesis.
Implications for Investors and the Path Forward
The implications of the current market structure are twofold:
- The Case for Caution: The lack of robust spot demand is the primary concern. If the $80,500 level fails to hold, the market could enter a period of prolonged sideways movement or a retest of lower support levels, potentially shaking out weaker hands.
- The Case for the Bullish Reversal: A convincing, volume-backed move above $85,000 would invalidate the current bearish sentiment. This would require more than just technical momentum; it would necessitate a fundamental shift, such as positive regulatory developments or an increase in institutional allocation through Bitcoin ETFs.
The Role of Institutional Capital
Institutional investors are currently watching the $80,500–$85,000 range with bated breath. For institutional players, the cost basis is not just a line on a chart; it is a fiduciary threshold. If the market demonstrates that it can defend the $80,500 line, it provides a "safe" entry point for large-scale capital, which in turn reinforces the asset’s price stability.
However, should the price fail to maintain this support, the ensuing volatility would likely drive institutional capital to the sidelines, at least temporarily, until a clearer trend emerges. This "wait and see" approach is common during market transitions, and it explains why volume has thinned out in recent sessions.
Final Summary and Conclusion
Bitcoin currently finds itself in a state of delicate suspension. The structural bullishness that characterized the year remains a background reality, but the short-term tactical situation is defined by a lack of conviction.
The $80,500 support level is the primary watchpoint for market participants. It serves as the dividing line between a healthy consolidation and a breakdown. If bulls can maintain this level and use it as a launchpad to clear the $85,000 overhead resistance, the market may return to a path of growth. Conversely, if the lack of spot demand persists and the liquidation clusters at the higher end remain unabsorbed, Bitcoin may be forced to endure a deeper correction to flush out remaining leverage.
In the coming days, market participants should prioritize tracking onchain volume and exchange inflows. A spike in inflows could signal further profit-taking, while consistent, low-volume stability at the current price would suggest that the "bottoming" process is successfully underway. Ultimately, Bitcoin’s ability to move past its current sentiment funk will depend on its capacity to transform its current technical floor into a base for sustained, institutional-led growth. For now, the market remains in a "wait-and-see" mode, with the $80,500 line holding the weight of the immediate future.