Executive Summary: A Snapshot of Rail Resilience
As the North American logistics sector navigates the complexities of the mid-decade supply chain environment, the latest data from the USDA AgTransport Surface Transportation Board (STB) Railroad Service Metrics dataset provides a definitive look at the state of freight movement. According to the report dated October 3, 2026, containerized traffic has solidified its position as the primary driver of rail activity across major North American carriers.
The dataset, which encompasses 276 rows of granular operational metrics, details performance across 23 distinct commodity categories. It highlights not only the volume of originated and received freight but also provides a window into the current state of service reliability for the continent’s six largest railroads: BNSF, Union Pacific (UP), Norfolk Southern (NS), CSX, Canadian National (CN), and Canadian Pacific Kansas City (CPKC). With global port congestion currently tying up an estimated 12% of total container capacity, the railroads’ ability to process intermodal traffic has become a critical barometer for the health of the broader domestic economy.
Chronology of October 2026 Freight Activity
The tracking period, which concluded in early October, paints a picture of a rail network operating at high intensity. The submission of these metrics on October 7, 2026, confirmed that despite persistent headwinds in global maritime logistics, rail throughput remains a consistent backbone for North American commerce.
Week-by-Week Operational Cadence
Throughout the first week of October, the railroads demonstrated a clear hierarchy in total traffic volume. BNSF emerged as the leader in total carload value, recording 204,045 units. Union Pacific followed closely with 178,793, while the Eastern Class I carriers, Norfolk Southern and CSX, reported 144,131 and 132,521 respectively. The Canadian carriers, while smaller in total volume, remained essential links in the transcontinental chain, with CN reporting 45,591 and CPKC reporting 29,622 carloads.
This data sequence serves as a vital touchpoint for shippers and policymakers, offering a "real-time" pulse of industrial activity before the traditional Q4 holiday peak season surges.
Deep Dive: Supporting Data and Commodity Breakdown
Container Volumes: The Engine of Rail Traffic
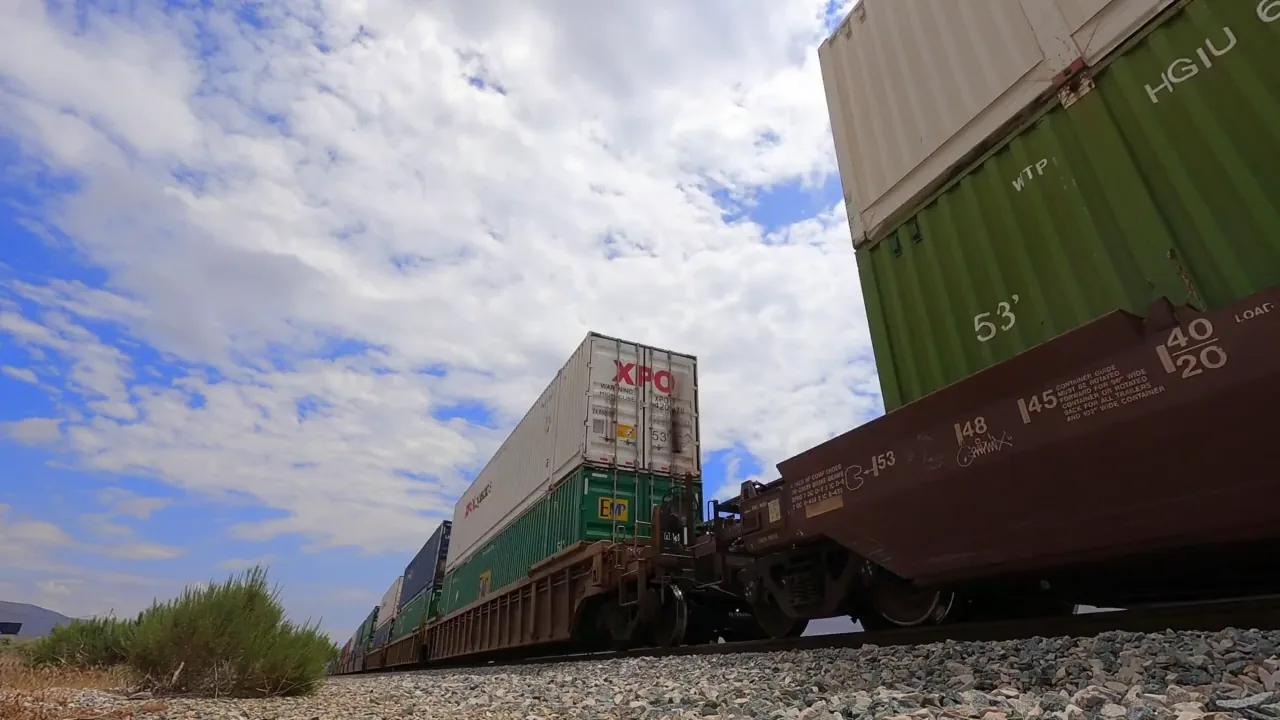
Containerized freight continues to dwarf traditional bulk and break-bulk commodities. BNSF remains the undisputed leader in intermodal origination, reporting 104,578 originated containers—a figure that underscores the railroad’s dominance in the trans-Pacific trade lane. Union Pacific followed with 71,709, while NS and CSX handled 63,237 and 50,053, respectively.
The "received" container metrics reveal the distribution patterns of these goods as they move inland from port-adjacent hubs. Norfolk Southern leads the received category with 16,896 units, suggesting a robust secondary movement of goods into the highly populated industrial centers of the American Midwest and Northeast.
Coal and Chemicals: The Foundation of Industrial Bulk
While containers dominate the headlines, the bedrock of rail freight remains the heavy industrial commodities. Coal, despite ongoing energy transition efforts, continues to occupy significant track capacity. BNSF originated 21,504 coal carloads, with UP contributing another 14,031.
Chemical logistics, a complex and high-value segment of the rail business, showed significant activity for Union Pacific, which originated 18,036 chemical carloads—more than double that of its closest competitor, BNSF. This volume reflects the intense concentration of the chemical manufacturing industry along the U.S. Gulf Coast, where UP maintains an expansive network footprint.
Agricultural and Automotive Throughput
Grain shipments represent a seasonal priority for railroads, particularly as the harvest cycle peaks in the fall. BNSF’s 12,118 originated grain carloads highlight its role in moving the Midwestern harvest to export terminals. CPKC, following its merger, has increasingly positioned itself as a critical conduit for cross-border grain movement, originating 3,925 carloads.
The automotive sector, which has faced varying degrees of supply chain volatility throughout 2026, saw steady rail movement. Norfolk Southern led the origination of motor vehicles and equipment with 6,143 carloads, signaling the continued importance of rail in the "Just-in-Time" automotive supply chain connecting parts suppliers to assembly plants across the Great Lakes region.
Construction and Raw Materials
The movement of sand, gravel, and crushed stone—essential inputs for infrastructure projects—remains a major category. Union Pacific’s 7,246 originated carloads in this sector highlight the ongoing demand for construction materials, likely driven by federal infrastructure investment projects reaching their maturity phase in late 2026.
Official Perspectives and Regulatory Oversight
The USDA AgTransport STB metrics are not merely statistical exercises; they are the primary tools used by the Surface Transportation Board to monitor for "service failures" and ensure that the rail industry is meeting its common carrier obligations.
Recent reports from the STB suggest a cautious optimism regarding service reliability. By forcing transparency on metrics such as "train speed" and "terminal dwell time," the regulatory body has incentivized railroads to prioritize fluid network movement over short-term cost-cutting. While the railroads have faced criticism in years past for service backlogs, the October 2026 data indicates a level of stability that allows for the predictable movement of the aforementioned volumes.
Industry analysts note that the high volume of containers—while positive for revenue—places immense pressure on terminal capacity. When container volumes rise, the risk of "dwell time" (the time a container sits in a yard) increases, which can create a ripple effect of congestion throughout the rail network.
Implications for the Broader Economy
1. The Intermodal Dependency
The heavy reliance on containerized traffic implies that the health of the North American rail network is now inextricably linked to global maritime trade. With 12% of global container capacity currently tied up in port congestion, any disruption at major gateways—such as the Port of Los Angeles/Long Beach or the Port of New York and New Jersey—will be felt almost immediately in the rail metrics. Shippers are increasingly turning to rail as a way to circumvent drayage shortages, but this places the burden of velocity on the Class I railroads.
2. Infrastructure and Investment Trends
The data regarding stone, sand, and gravel, combined with the steady movement of metals and steel scrap, provides a window into the capital expenditure cycles of the nation. As these raw materials move through the rail network, they indicate that the manufacturing and construction sectors are maintaining a consistent pace of operation. For logistics managers, this suggests that the "freight recession" concerns that lingered in previous years have largely transitioned into a period of stable, if not spectacular, growth.
3. The Future of Energy and Raw Materials
The sustained volume of chemicals and coal reveals that the transition to a greener economy is still in its early stages as far as freight tonnage is concerned. While the long-term trend for coal is widely considered to be in decline, the short-term reality of 2026 shows it remains a vital commodity that provides the railroads with consistent, predictable revenue streams.
4. Supply Chain Resilience
The diversity of the commodities listed—from food products and grain mill goods to pulp and paper—demonstrates that the North American rail network is successfully managing a "mixed-use" model. The ability to balance time-sensitive consumer goods (containers) with bulk raw materials (coal, ore, chemicals) is the true test of a rail network’s efficiency.
Conclusion: Looking Ahead to Q4 2026
As the industry moves deeper into the fourth quarter, the October 2026 STB dataset serves as a foundational benchmark. With intermodal traffic holding steady as the primary volume driver, the focus for the remainder of the year will shift to the railroads’ ability to manage seasonal peaks without succumbing to the congestion that plagued the sector in previous years.
For stakeholders, the message is clear: while the infrastructure is under significant pressure due to the sheer volume of containerized goods, the rail network is currently operating with a level of granular efficiency that, if maintained, should keep the North American supply chain resilient through the end of the year. The collaboration between the USDA, the STB, and the private railroads remains a critical component in ensuring that these metrics—and the economic activity they represent—remain in balance.