In an era where artificial intelligence and automated decision-making systems serve as the backbone of modern enterprise, the integrity of underlying data has transitioned from a technical "housekeeping" task to a core business imperative. As organizations grapple with the complexities of digital transformation, the central question remains: Is our data fit for its intended use?
This article serves as a comprehensive guide to mastering data quality metrics—the quantifiable indicators that bridge the gap between raw information and reliable business outcomes.
The Strategic Importance of Data Quality
Data quality is no longer a siloed concern for IT departments. In the current business climate, poor data quality is directly linked to operational inefficiency, failed AI initiatives, and skewed strategic insights. As highlighted in the BARC Data, BI, and Analytics Trend Monitor 2026, data quality management remains one of the most critical challenges facing organizations today.
Measuring data quality involves more than just identifying "bad" data; it requires a systematic approach to quantifying the performance of data sets, elements, and processes against predefined business requirements.
The Anatomy of a Metric
To measure data quality effectively, organizations must distinguish between the components that make up a metric:
- Business Requirements: The specific context (e.g., a B2B order process).
- Data Quality Dimensions: The attributes being measured (e.g., completeness).
- Rules: The testable condition (e.g., "Email field must not be empty").
- Checks: The technical execution (e.g., SQL/Python scripts).
- Metrics: The aggregated percentage or score reflecting the quality status.
Chronology of a Data Quality Implementation
Implementing a robust measurement framework does not happen overnight. Organizations typically follow a predictable lifecycle when integrating these metrics into their operations.

Phase 1: Requirement Identification (Weeks 1-4)
Before writing code or configuring software, teams must engage stakeholders. If a B2B company wants to improve customer outreach, the requirement is that every order must contain a verified email address. The "why" drives the "what."
Phase 2: Dimension Mapping (Weeks 5-6)
Once requirements are set, they must be classified. Is the issue one of accuracy (is the email correct?), completeness (is the field populated?), or validity (does it follow the correct format: [email protected]?).
Phase 3: Rule Definition and Technical Validation (Weeks 7-10)
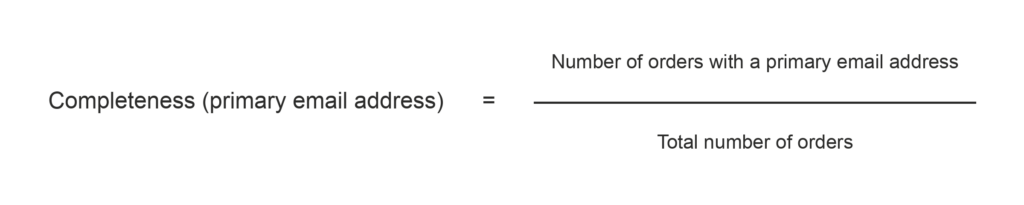
Engineers translate business requirements into technical rules. A rule for completeness would be: Count of orders with non-null emails / Total count of orders. This creates a percentage-based metric that is easily understood by both technical and non-technical staff.
Phase 4: Setting Thresholds and Monitoring (Ongoing)
Once a baseline is established, teams set escalation thresholds. For instance, a 95% completion rate might be "acceptable," while a drop below 85% triggers an automated alert to the data steward.
Supporting Data: Dimensions of Quality
Data quality dimensions act as the mental model for analyzing data health. While there are many, the industry standard focuses on seven primary pillars:
- Accuracy: Does the data reflect the real-world entity it represents?
- Completeness: Is all required data present?
- Consistency: Does the data remain the same across different systems?
- Timeliness: Is the data available when the business needs it?
- Validity: Does the data conform to defined syntax and format?
- Uniqueness: Are there duplicate records representing the same entity?
- Relevance: Does the data actually serve the intended business purpose?
According to recent BARC research on Harnessing Unstructured Data for AI Innovation, 54% of practitioners cite "accuracy" as the primary metric for AI readiness, followed by "timeliness" at 31%. This underscores that in the age of AI, the requirements for data quality are becoming more stringent.

The Role of KPIs and Observability
It is essential to differentiate between a standard data quality metric and a Key Performance Indicator (KPI). A metric provides the pulse of a specific data set; a KPI connects that pulse to a management objective.
For example, a metric might track the number of "null" addresses in a specific CRM table. A KPI, however, tracks the "Impact of Data Quality on Sales Conversion Rates." When the KPI dips, it signifies a direct impact on revenue, elevating the issue to an executive priority.
The Rise of Data Observability
Modern data management is adopting "data observability"—a practice borrowed from IT infrastructure monitoring. By applying continuous measurement and anomaly detection across the data estate, teams can move from reactive "firefighting" to proactive management. This allows organizations to identify deterioration in data quality before it triggers a critical failure.
Official Perspective: Avoiding "Alert Fatigue"
One of the most common pitfalls in data quality management is the proliferation of irrelevant alerts. Florian Bigelmaier, an expert in Data Management at BARC, emphasizes that context is king.
"Defining thresholds takes detailed work," says Bigelmaier. "If you start your day with 20 irrelevant data quality warnings, you create notification fatigue. Eventually, the team stops looking at the alerts entirely, and material problems go undetected."
Best Practices for Threshold Management
- Avoid Over-Alerting: Only set alerts for metrics that, if they fail, have a direct negative impact on the business.
- Contextualize: Always compare the latest data point against a historical baseline. A sudden 5% drop may look alarming, but if it is a seasonal, expected dip, it should not trigger an escalation.
- Assign Ownership: Every metric and threshold must have a named reviewer. Data without an owner is data that will inevitably decay.
Implications for AI and Future-Proofing
The rapid evolution of Artificial Intelligence is fundamentally changing the requirements for data quality. AI models are notoriously sensitive to the quality of their training data; as the saying goes, "garbage in, garbage out."
Data Quality as an AI Enabler
As organizations shift toward AI-driven decision-making, the definition of "high-quality data" is becoming increasingly context-dependent. Data that is perfectly acceptable for a monthly financial report may be completely unfit for training a real-time, high-stakes machine learning model.
Strategic Recommendations
- Don’t Pursue Perfection: There is no "100% perfect" data. Focus on the quality levels required for the specific use case.
- Embrace the Lifecycle: Use the data quality management lifecycle to connect measurement to business outcomes.
- Invest in Tooling: As the volume of data grows, manual checks are insufficient. Compare and invest in data quality and observability solutions that automate the detection and remediation process.
Conclusion
Data quality is the invisible foundation of the modern enterprise. By moving from ad-hoc, reactive checks to a disciplined, metrics-driven approach, organizations can protect their most valuable asset. The journey involves selecting the right dimensions, setting meaningful thresholds, and fostering a culture where data health is tied directly to business performance.
As we look toward 2026 and beyond, the ability to maintain high-quality data will be the primary differentiator between organizations that successfully leverage AI and those that are sidelined by the complexities of their own infrastructure.
Frequently Asked Questions (FAQ)
What exactly is a data quality metric?
A data quality metric is a quantifiable measure of how well a data set or element meets the requirements of a specific business use case. It is the result of applying a rule to a set of data and aggregating the outcome into a single, actionable value.
Why are there so many dimensions of data quality?
Different business needs require different types of verification. While accuracy is critical for financial reporting, completeness might be more important for a marketing email campaign. The dimensions provide a structure to ensure you are measuring what actually matters for your specific goal.
How do I know which metric is a KPI?
If a metric is tied to a high-level management objective—such as revenue generation, compliance, or customer satisfaction—it qualifies as a KPI. KPIs should trigger immediate executive attention when they fall outside of acceptable ranges.
Can I automate data quality management?
Yes, and for most modern enterprises, it is a necessity. Using data observability tools, you can automate the execution of rules, the tracking of metrics, and the alerting process, allowing your data stewards to focus on resolving systemic issues rather than manually checking for errors.
What happens if I set my thresholds too tightly?
Setting thresholds too tightly leads to "noise." You will receive constant alerts for minor, inconsequential deviations. This leads to alert fatigue, where your team becomes desensitized to notifications, eventually missing the critical alerts that signal real, business-impacting data failures. Always test thresholds against historical data to ensure they strike the right balance.