
Bitcoin (BTC) has entered a critical juncture that mirrors the hallmark technical and psychological patterns of previous bull market cycles. With a sharp 7% rally pushing the premier cryptocurrency back into the $85,000–$90,000 range—a price territory not seen since early 2025—investors and analysts are weighing the sustainability of this momentum against clear signals of an overheated market.
As short-term holders finally reach breakeven points and institutional capital pours into ETFs at record-breaking speeds, the market is currently caught in a tug-of-war between structural health and speculative exhaustion.
Main Facts: The Current Market State
The recent price action has fundamentally altered the landscape for short-term Bitcoin holders. For the past several months, investors who entered the market within the last 150 days were largely "underwater," sitting on unrealized losses. As BTC reclaimed the $85k mark, these participants have effectively reached their breakeven threshold. This is a vital psychological pivot; when short-term holders are no longer losing money, the "sell-side" pressure from panic-sellers diminishes, potentially providing a firmer foundation for further upward movement.
However, this recovery has been accompanied by a surge in market sentiment that rings alarm bells for veteran observers. On September 22nd, the widely followed "Fear and Greed Index" officially entered the "Extreme Greed" territory for the first time since the third quarter of 2025. Market data suggests that current sentiment is actually more "stretched" than it was when Bitcoin reached its $126,000 peak in late 2025. This divergence between price levels and sentiment indicates that market participants are currently more euphoric than they were at significantly higher historical valuations.
Chronology: The Road to the $90,000 Test
To understand where Bitcoin is headed, one must look at the recent timeline of events that catalyzed this move:
- Early 2025: Bitcoin established a high-range ceiling between $85,000 and $90,000, serving as a primary target for bulls throughout the year.
- Late Q3 2025: Following a period of consolidation, Bitcoin hit an interim peak of $126,000, driven by a wave of institutional adoption.
- Early September 2026: After a period of corrective cooling, momentum began to shift back in favor of the bulls.
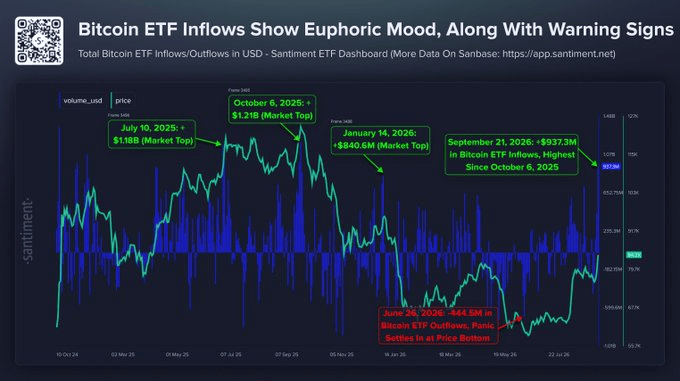
- September 21, 2026: Bitcoin ETFs recorded a massive $937.3 million in net inflows—the largest single-day influx since the October 2025 market peak. This served as the primary ignition switch for the current 7% rally.
- September 22, 2026: The Fear and Greed index flashed "Extreme Greed," signaling that the retail and institutional "Fear Of Missing Out" (FOMO) had officially returned.
Supporting Data: On-Chain Metrics and ETF Dominance
The current rally is heavily bolstered by institutional behavior. According to reports from Santiment, the demand for spot Bitcoin ETFs has surged to levels not seen in nearly a year. This influx of capital acts as a double-edged sword; while it provides massive buy-side liquidity, it also concentrates the market’s reliance on institutional sentiment.

The MVRV Crossover
Data from Glassnode highlights a significant technical indicator: the MVRV (Market Value over Realized Value) ratio. Historically, when the MVRV crosses back above its 365-day average after a period of negative momentum, it signals that the market is entering a "healthier" profit zone. This crossover was a precursor to major recovery phases in both 2019 and 2023. Current charts show a similar crossover forming, suggesting that the underlying "realized" value of the Bitcoin network is catching up to the "market" price, validating the recent gains as fundamentally backed rather than purely speculative.
Liquidation Heatmaps
While the spot market shows strength, the derivatives market warns of volatility. CoinGlass liquidation heatmaps indicate a massive cluster of long-position liquidity just above the current trading range. In market parlance, this suggests that the market is "leveraging up." If Bitcoin fails to break the $90,000 resistance level convincingly, these leveraged long positions face the risk of mass liquidation, which could trigger a "bull trap" and a subsequent sharp price reversal.
Official Responses and Analyst Perspectives
Market analysts remain divided on the outcome of the $90,000 resistance test. Institutional strategists point to the ETF inflow data as a sign of long-term conviction. "When you see record inflows alongside a return to profitability for short-term holders, you are looking at a market that is structurally shedding its dead weight," noted one digital asset analyst.
Conversely, technical analysts are advising caution regarding the "Extreme Greed" reading. "Euphoria is the death of a rally," stated a lead market researcher. "When the index shows we are more greedy than we were at $126k, it means the market is overextended. The $90,000 level is a psychological wall, not just a mathematical one. We are essentially waiting to see if the institutional bid is strong enough to absorb the profit-taking that typically happens at these resistance levels."
Implications: The Path Forward
As Bitcoin approaches the $90,000 threshold, the market faces three potential scenarios:
1. The Breakout Scenario
If the current ETF inflows persist and the "short-term holder" base continues to hold rather than sell, the resulting reduction in available supply could force a "short squeeze." In this scenario, those betting against the $90,000 breakout are forced to cover their positions, providing the final push of buying pressure needed to clear the resistance and set a new trajectory toward the $100,000 milestone.
2. The Local Top/Correction
If the Fear and Greed index remains in "Extreme Greed" without a corresponding increase in volume, the market may experience a classic "local top." In this instance, the resistance at $90,000 proves too formidable, leading to a consolidation phase or a moderate retracement to the $80,000 support level, allowing the market to "cool off" before the next leg up.
3. The Bull Trap
The most bearish outcome involves a temporary breach of $90,000 that lacks volume, followed by a rapid liquidation of the aforementioned long positions. This would lead to a sharp, violent drop, shaking out over-leveraged traders and resetting the market’s leverage ratios.
Final Summary: Balancing Euphoria and Fundamentals
The current state of the Bitcoin market is a fascinating study in contrast. On one hand, the return to profitability for short-term holders and the robust return of institutional ETF demand provide a legitimate bullish thesis. The MVRV crossover suggests that this is not just another speculative bubble, but a cyclical recovery that mirrors the healthy growth patterns of previous years.
On the other hand, the return of "Extreme Greed" and the accumulation of high leverage in the derivatives market suggest that the market is becoming fragile. The $90,000 level is currently the most important price point on the map. Whether Bitcoin clears this hurdle with a sustained breakout or stalls under the weight of its own euphoria will determine the market’s tone for the remainder of the quarter.
Investors are advised to watch two key metrics in the coming weeks: the net inflow consistency of the spot ETFs and the behavior of the derivatives market as it approaches the $90,000 ceiling. If the liquidity provided by ETFs can absorb the selling pressure from profit-takers, the road to record-breaking highs may be open. If not, a period of consolidation is not only likely but perhaps necessary for the long-term health of the cycle.