Executive Summary
XRP, the native digital asset of the Ripple ecosystem, is currently navigating a period of heightened volatility and bearish sentiment. Following a failed attempt to sustain a rally toward the $1.40 threshold, the asset has experienced a sharp reversal, pulling its price back into a critical demand zone between $1.25 and $1.32. Technical indicators across both daily and 4-hour timeframes suggest that the asset’s bearish structure remains firmly in place, leaving market participants watching closely to see if current support levels can hold against renewed selling pressure.
The Chronology of the Recent Reversal
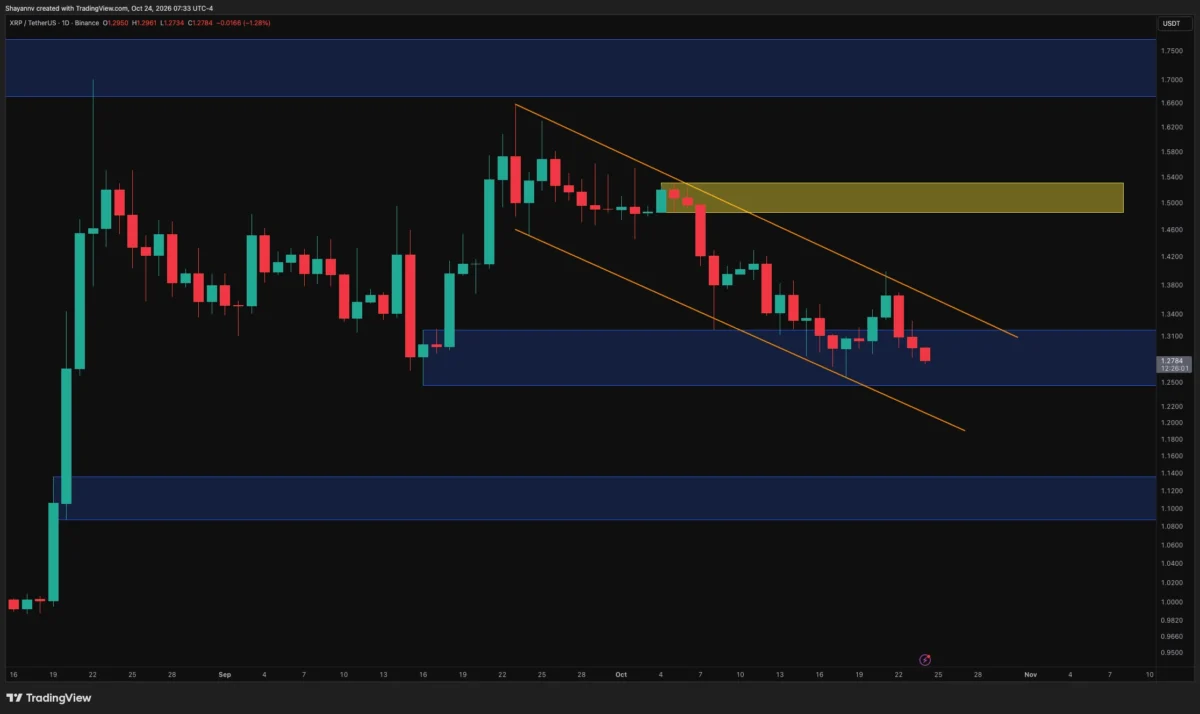
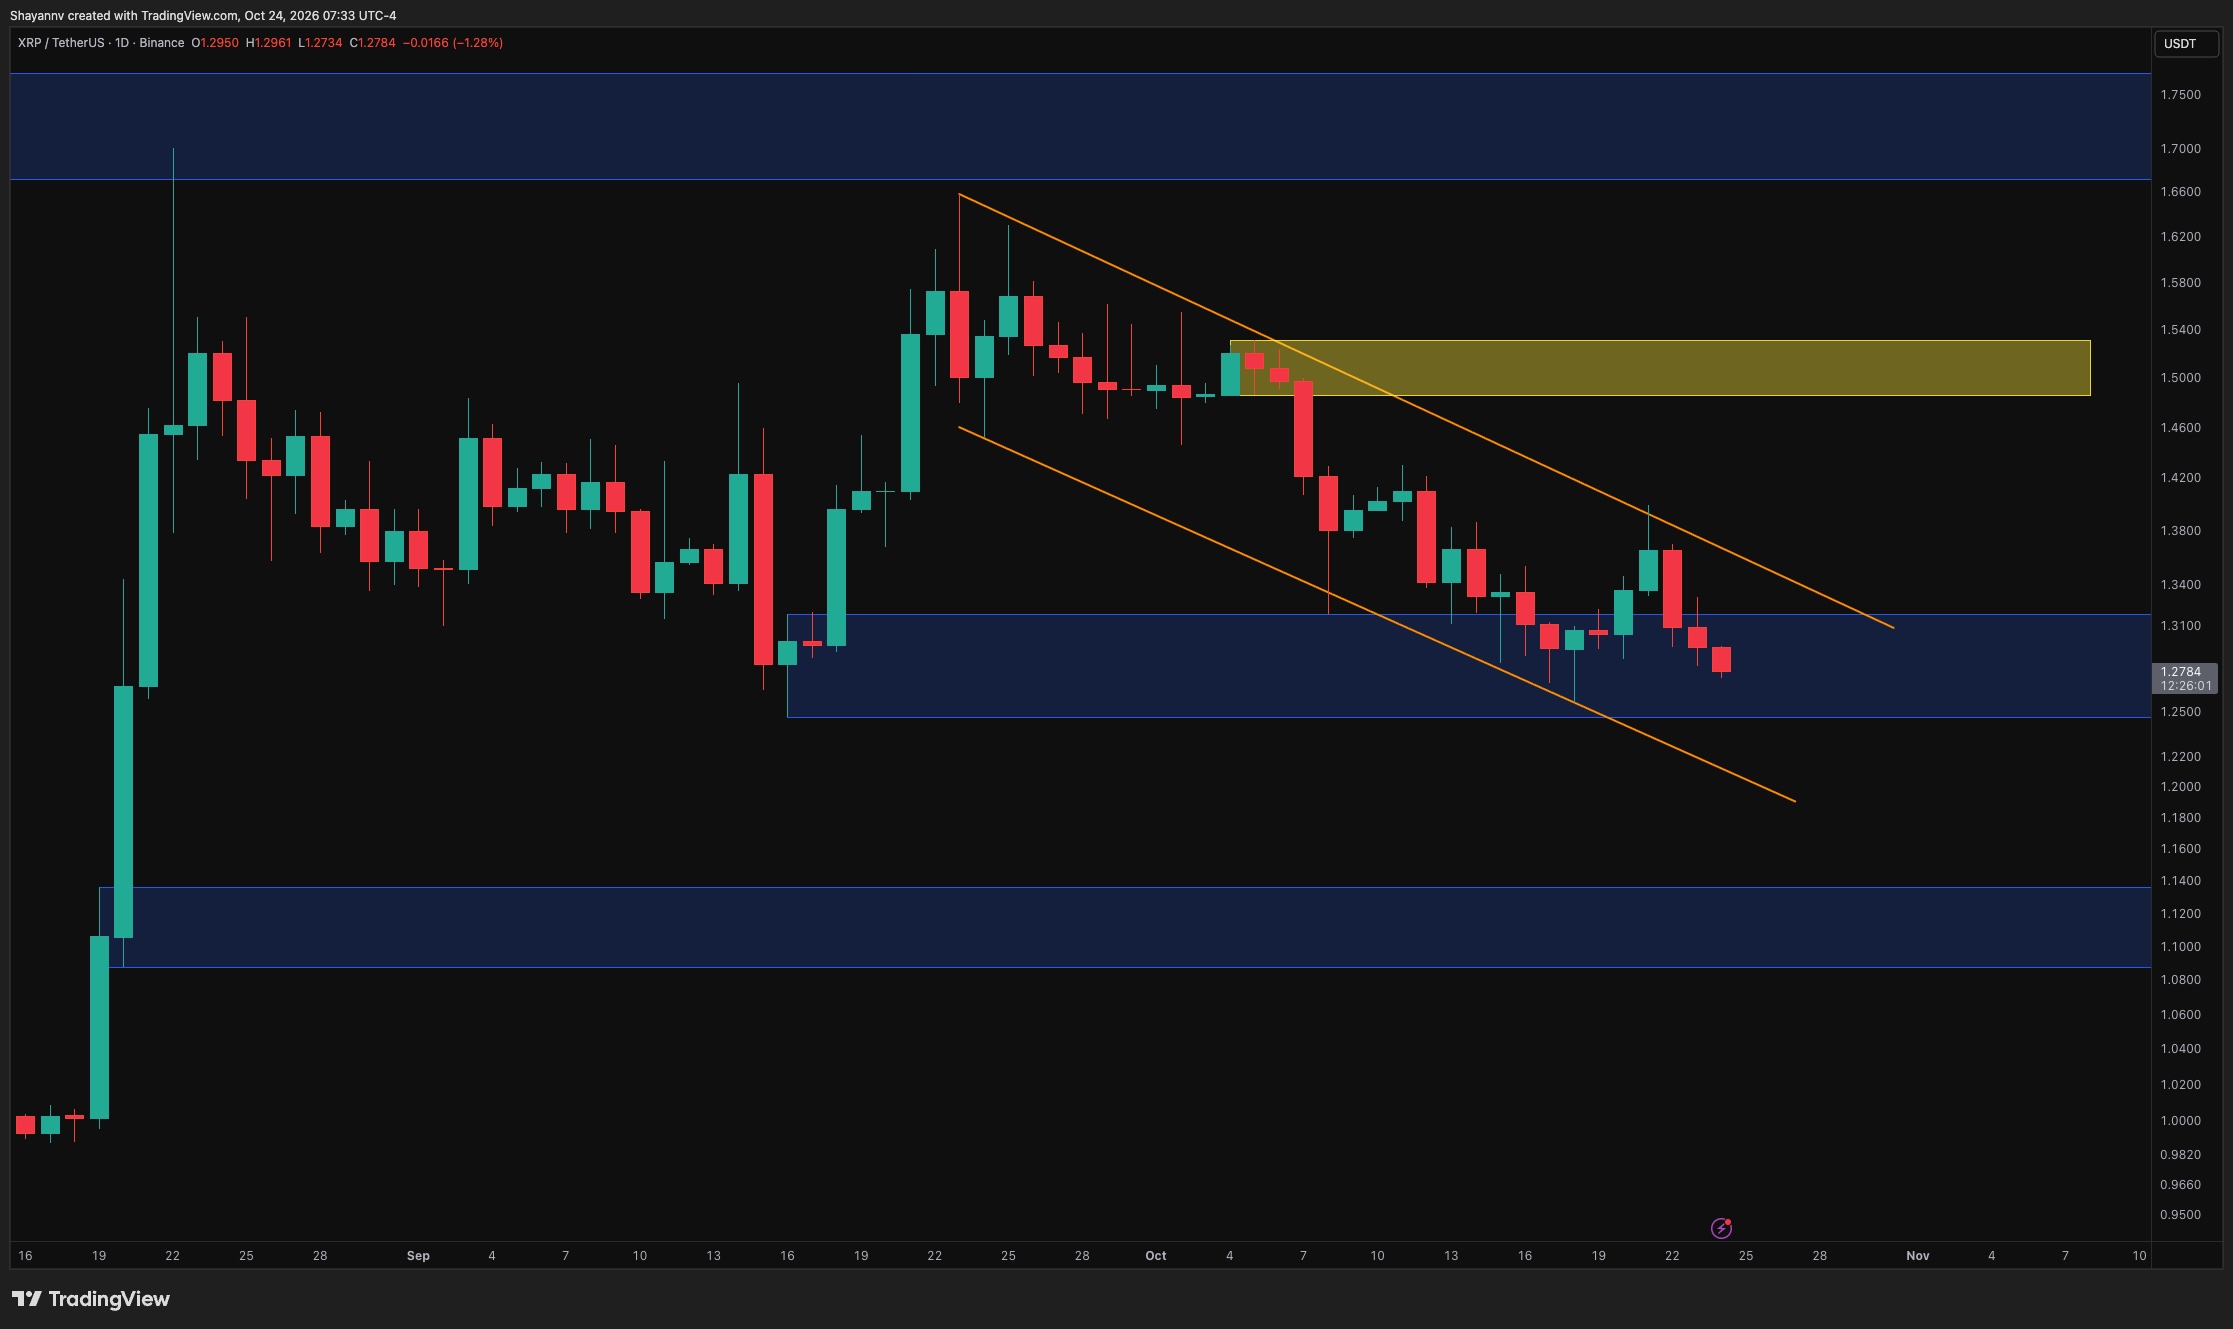
The recent price action for XRP has been defined by a struggle to break free from a descending channel that has persisted since its September peak. Throughout the last few weeks, investors witnessed a hopeful recovery, with XRP climbing toward the $1.37–$1.40 range. However, this optimism was short-lived as the asset collided with the upper boundary of its descending channel—a technical ceiling that has repeatedly stifled upward momentum.
The rejection at this resistance level triggered a series of consecutive bearish daily candles, effectively neutralizing the gains made during the preceding week. By the middle of the current trading cycle, XRP had retreated back into the $1.25–$1.32 demand zone. This area is historically significant, having previously acted as a springboard for price recovery; however, the current retest reveals a lack of conviction from buyers. The inability to sustain a bounce in this region signals that the market sentiment has shifted, with sellers now firmly in control of the near-term trajectory.
Technical Deep-Dive: Daily and 4-Hour Perspectives
The Daily Chart: Navigating the Descending Channel
On the daily timeframe, the structure is clearly defined by a pattern of "lower highs," a classic hallmark of a downtrend. The failure to breach the $1.40 barrier has solidified the bearish outlook. Analysts are now focusing on the $1.25 level; a decisive daily close below this mark would represent a significant technical breakdown.
If the $1.25 support is lost, the path of least resistance points toward $1.20, with a more substantial support floor identified between $1.09 and $1.14. Conversely, to invalidate the bearish thesis, XRP must reclaim the $1.32 level with high volume. Even if that occurs, the journey to a bullish reversal remains arduous, as the asset would need to navigate through the aforementioned descending resistance and clear the massive supply overhang located in the $1.48–$1.53 range.
The 4-Hour Chart: A Failed Liquidity Sweep
The 4-hour chart provides a more granular view of the recent "liquidity sweep" that occurred near the $1.39 level. In trading parlance, a liquidity sweep often lures breakout traders into the market before the price is aggressively pushed in the opposite direction. XRP briefly tapped the $1.38–$1.40 supply zone, only to be met with immediate, heavy selling pressure.
This rapid reversal confirms a "failed breakout," which is a bearish indicator in technical analysis. The price is currently hovering near the upper boundary of the $1.25–$1.28 demand zone. The speed of the recent decline suggests that the demand in this region is thinning. Should the price continue to drift lower without a sustained bullish response, the likelihood of a retest of the channel’s lower trendline increases significantly.
Supporting Data and Market Dynamics
The current price action is supported by several factors beyond simple chart patterns. Market volume has been erratic, reflecting a lack of consensus among traders. While the broader cryptocurrency market has seen varying levels of engagement, XRP’s specific sensitivity to its own supply-demand zones indicates that it is currently trading on its own technical merits rather than following the broader market trend.
Furthermore, the "supply zones" mentioned—specifically the $1.48–$1.53 area—represent historical accumulation levels where many investors who bought in at higher prices may be looking to break even or take profits. This creates a psychological barrier that requires significant capital inflow to overcome. Without a major fundamental catalyst, technical resistance at these levels is likely to remain formidable.
Official Responses and Ecosystem Context
While Ripple Labs itself maintains a focus on institutional adoption, cross-border payments, and the expansion of the XRPL ecosystem, market participants often conflate these developments with short-term price movements. Recent statements from company executives have remained bullish on the long-term utility of the XRP Ledger, particularly in the realm of tokenization and stablecoin integration.
However, it is vital to note that these long-term utility milestones rarely translate into immediate price action. The current market behavior is primarily driven by speculation and technical positioning. Analysts often warn that while the fundamentals of Ripple as a technology company remain strong, the market price of the XRP token is subject to the whims of sentiment, liquidity, and broader macroeconomic factors that influence the digital asset class as a whole.
Implications for Investors
For the retail investor and the seasoned trader alike, the current landscape presents a "wait and see" scenario. The implications of the current price action are two-fold:
- The Risk of Downside Extension: If the $1.25 demand zone fails to act as a pivot point, the technical damage to the chart will be significant. Investors holding through this period must consider the potential for a deeper correction toward the $1.10 level, which would represent a major retest of long-term support.
- The Opportunity for Reversal: Conversely, a hold at these levels, followed by a surge through the $1.32 resistance, would provide the first sign of a potential trend reversal. For those looking to enter the market, a confirmation of a "higher low" on the 4-hour timeframe is often considered a safer entry than attempting to catch a falling knife during a steep decline.
Strategic Considerations
Investors are advised to remain cognizant of the following:
- Stop-Loss Management: Given the volatility, maintaining tight risk management protocols is essential. A break below $1.25 is widely viewed as a technical trigger for further downside.
- Avoiding Over-Leverage: The rapid reversals witnessed on the 4-hour chart are typical of markets designed to liquidate over-leveraged positions. Maintaining a cash-heavy position or reducing leverage can mitigate the risks of these sudden volatility spikes.
- Macro Correlation: While XRP has its own technical structure, it remains correlated with the performance of Bitcoin and Ethereum. If the broader market experiences a liquidity crunch, even strong technical support zones in XRP may not be sufficient to prevent a decline.
Conclusion
XRP stands at a precarious juncture. The bearish structure, characterized by lower highs and a failed breakout attempt, necessitates caution. The immediate fate of the asset rests on the stability of the $1.25–$1.28 demand zone. If buyers can defend this area and mount a sustained recovery, the path toward reclaiming the $1.40 level—and eventually testing the $1.50 supply zone—may be reopened. However, in the absence of such strength, the probability of further downward consolidation remains high.
As always, market participants should prioritize independent research and consider the inherent risks of cryptocurrency trading. Technical analysis provides a roadmap, but market volatility remains the ultimate arbiter of price.
Disclaimer: The information provided in this analysis is for educational purposes only and does not constitute financial, investment, or trading advice. CryptoPotato and its contributors are not responsible for any financial losses or decisions made based on this information. Cryptocurrency markets are highly volatile; please conduct your own due diligence and consult with a certified financial advisor before making any investment decisions.