Bitcoin, the world’s leading cryptocurrency, currently finds itself at a critical crossroads. As the market attempts to find its footing after months of volatility, the interplay between institutional capital flows and the behavior of long-term holders has created a complex, uncertain landscape. Recent data suggests that the anticipated recovery for Bitcoin (BTC) is hitting significant resistance, fueled by a combination of investor fatigue and a reversal in sentiment among institutional market participants.
For many recent entrants, the dream of a quick profit has been replaced by the tactical goal of reaching a breakeven point. As prices stagnate, the pressure to liquidate positions before further decline becomes a self-fulfilling prophecy, capping potential upside momentum.
The Cost Basis Challenge: The Psychological Hurdles to Recovery
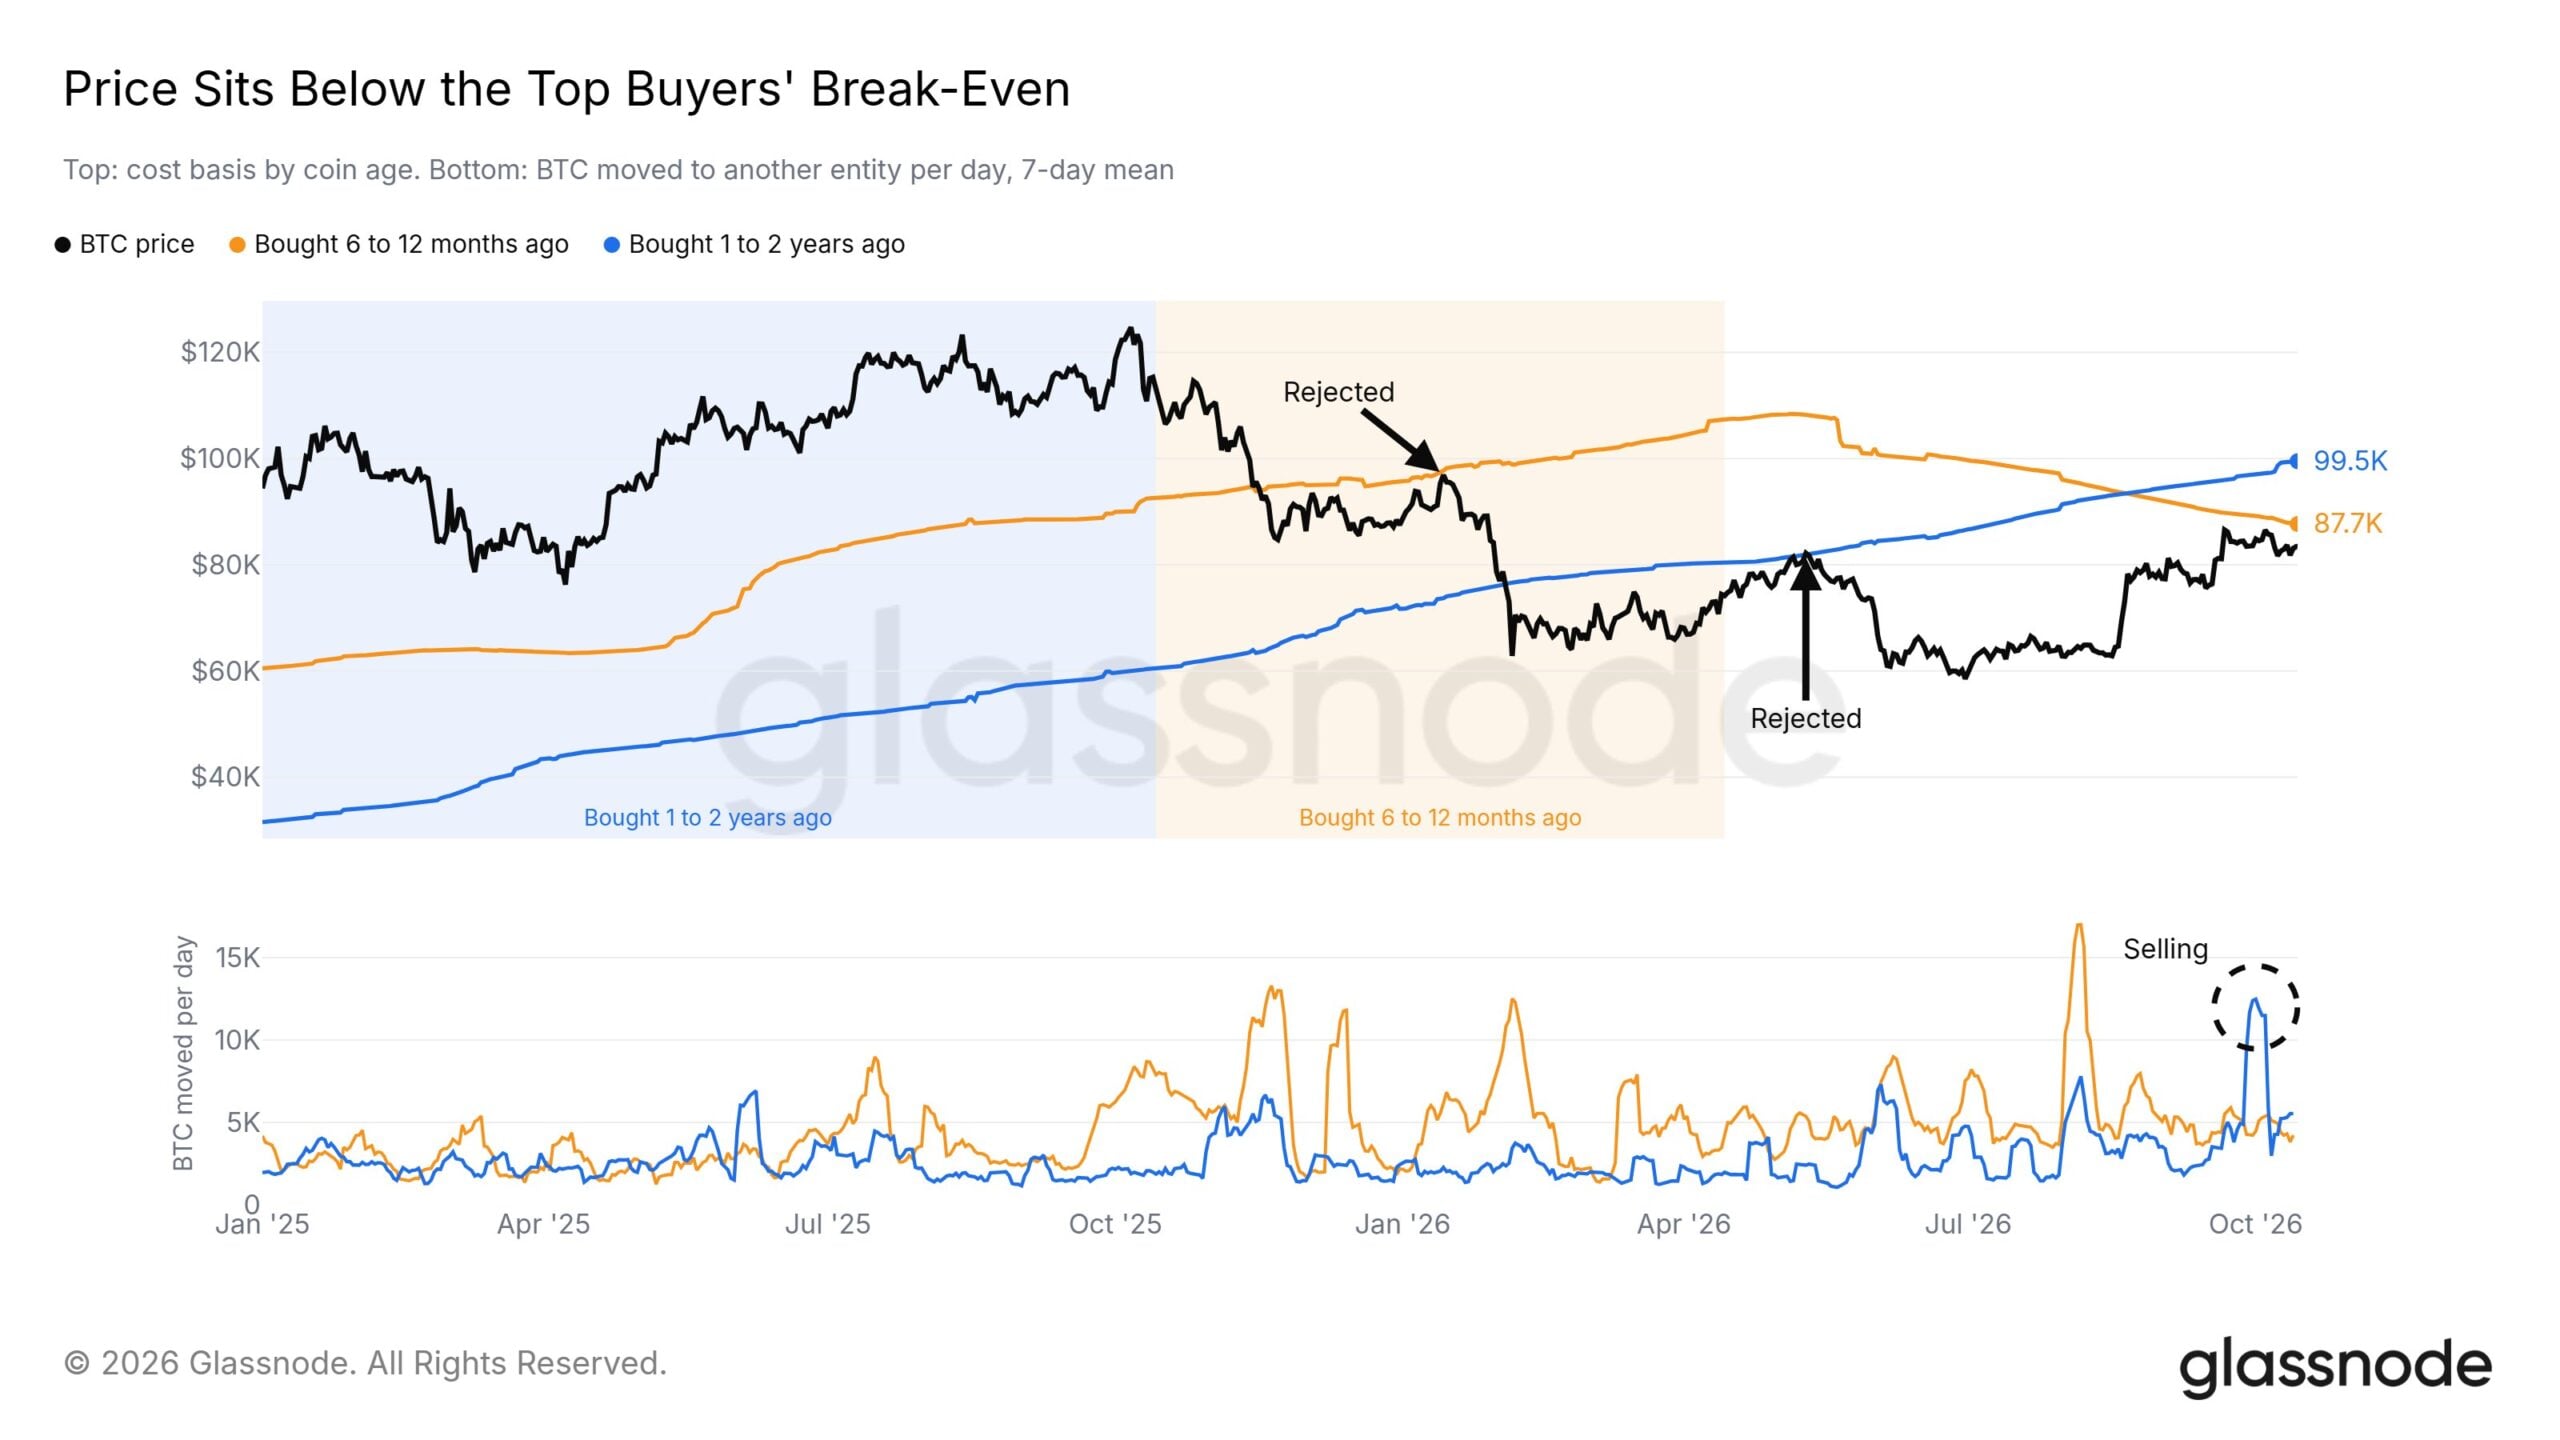
The current market malaise is rooted in the "cost basis" of various cohorts of investors. According to on-chain analytics firm Glassnode, a significant volume of Bitcoin was acquired during the last two years, creating a "ceiling" of psychological and financial resistance.
For investors who entered the market between six and twelve months ago, the current price levels represent a painful unrealized loss. Data indicates that these participants are waiting for the price to reach approximately $88,000 before they can exit their positions at a breakeven point. Similarly, those who acquired their holdings one to two years ago face an even steeper climb, needing a rally to $99,500 to recover their initial capital.

This phenomenon creates a "sell-side liquidity trap." As soon as the price attempts a rally, these underwater investors often look to trim their positions, resulting in heavy selling pressure that stalls upward movement. The market is essentially fighting a war against its own recent history, where every uptick is met with institutional and retail profit-taking or breakeven selling.
Chronology of the Current Market Shift
The market’s recent turn of fortune can be traced back to the first week of October, marking a stark departure from the bullish trends observed in September.
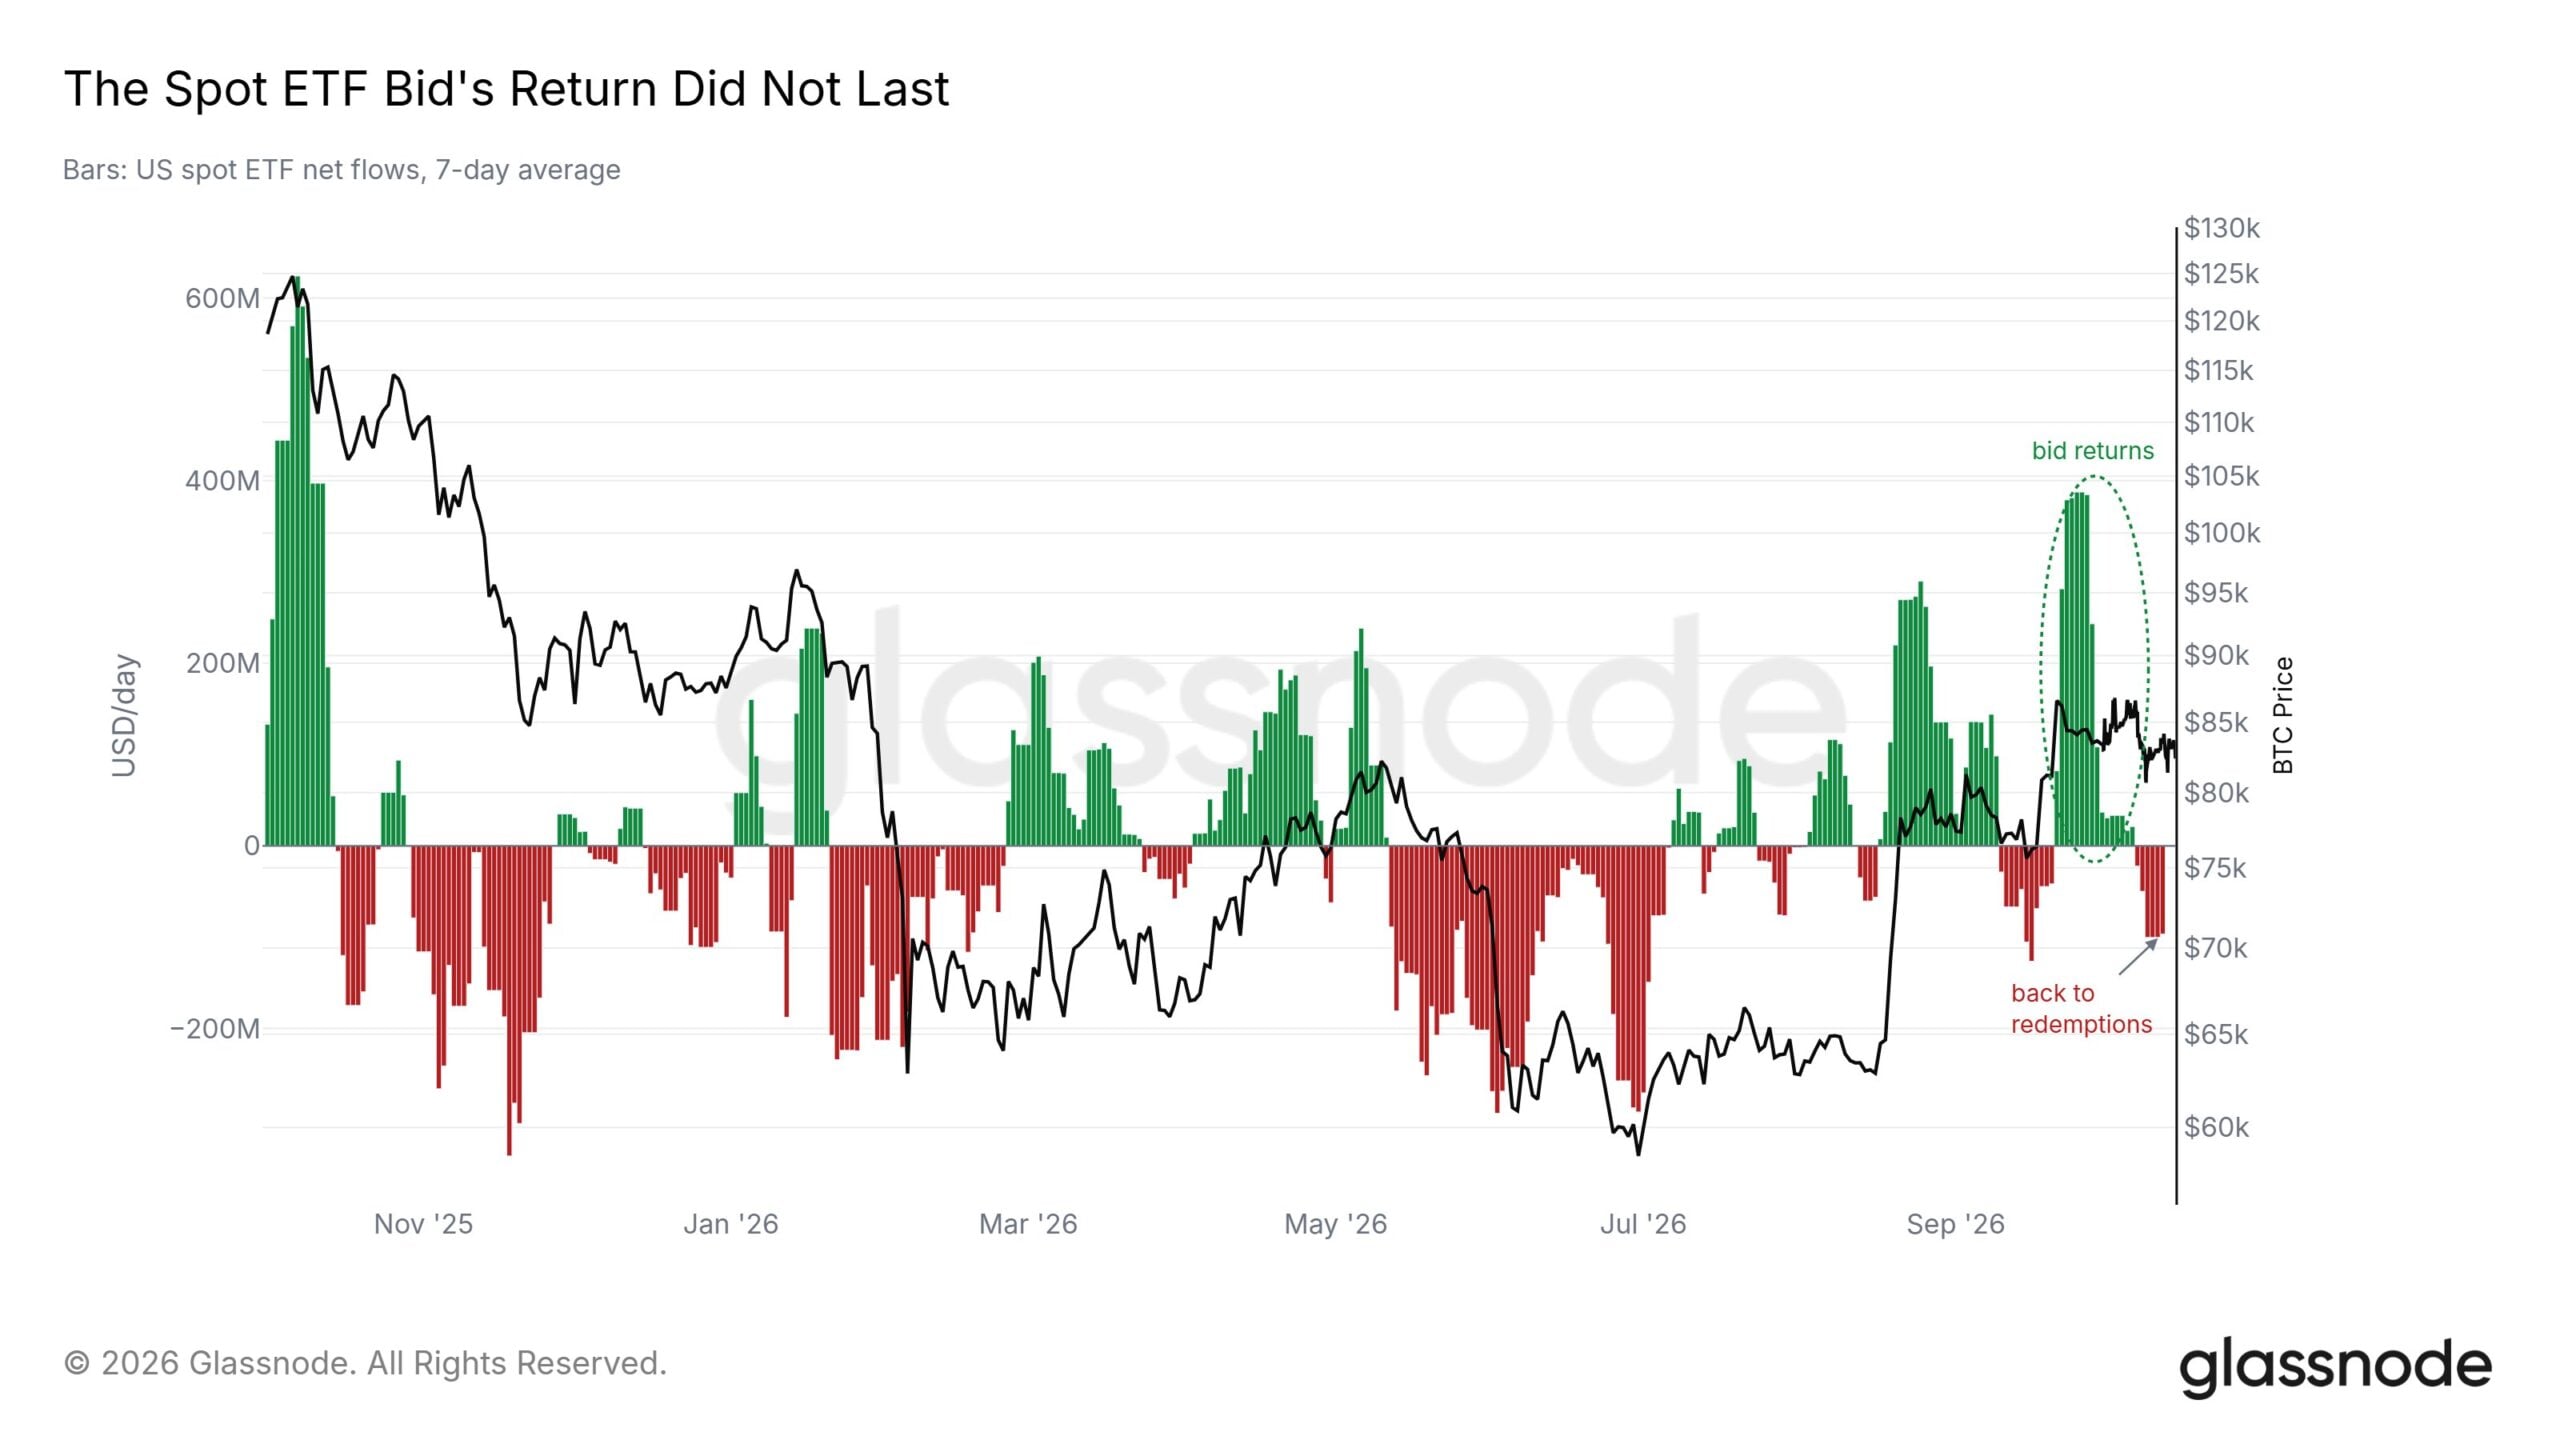
- Early October (Oct 7): The trend began to shift as U.S. spot Bitcoin ETFs, which had been the primary drivers of demand, reported significant outflows. This date served as the catalyst for a $760 million net outflow trend that has persisted through mid-October.
- Mid-October (Oct 8–14): The downward pressure intensified. Following the initial sell-off on October 7, further substantial withdrawals were recorded on October 8 and October 14, effectively erasing some of the gains made in the preceding weeks.
- Late October: The market currently reflects the aftermath of these institutional withdrawals. Cumulative net inflows into spot ETFs have dipped to approximately $56.96 billion, while total net assets held by these funds have retracted to $104.83 billion.
This timeline highlights a rapid evaporation of the "institutional enthusiasm" that defined the late summer and early autumn. The reversal of the strong inflows reported in previous months has left a vacuum in demand that the current retail market is struggling to fill.
Supporting Data: ETF Flows and Whale Activity
The dynamics of the current market are best illustrated by the tug-of-war between institutional ETFs and large-scale individual holders, commonly referred to as "whales."
The ETF Institutional Reversal
The U.S. spot Bitcoin ETFs have transformed from a catalyst for growth into a source of volatility. The $760 million in net outflows since October 7 indicates that institutional investors—or the clients of these asset managers—are actively de-risking. This creates a supply-side imbalance, as ETF providers must sell underlying Bitcoin to meet redemption requests, thereby flooding the market with more supply than the current demand can absorb.
The Whale Paradox
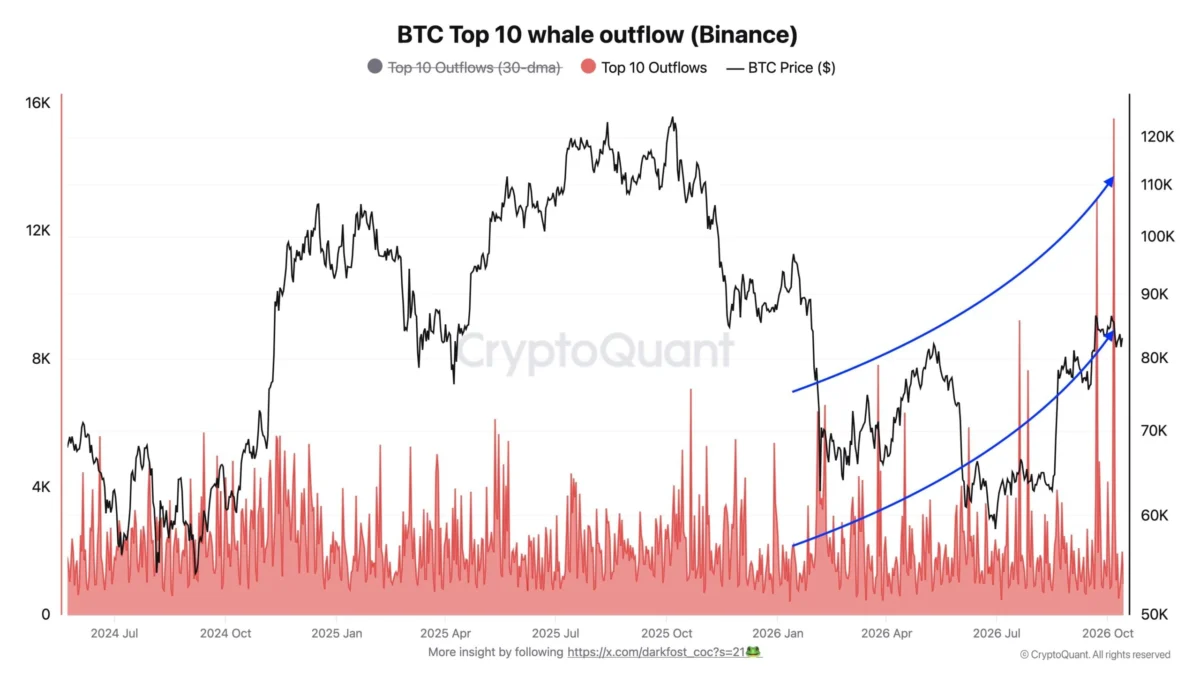
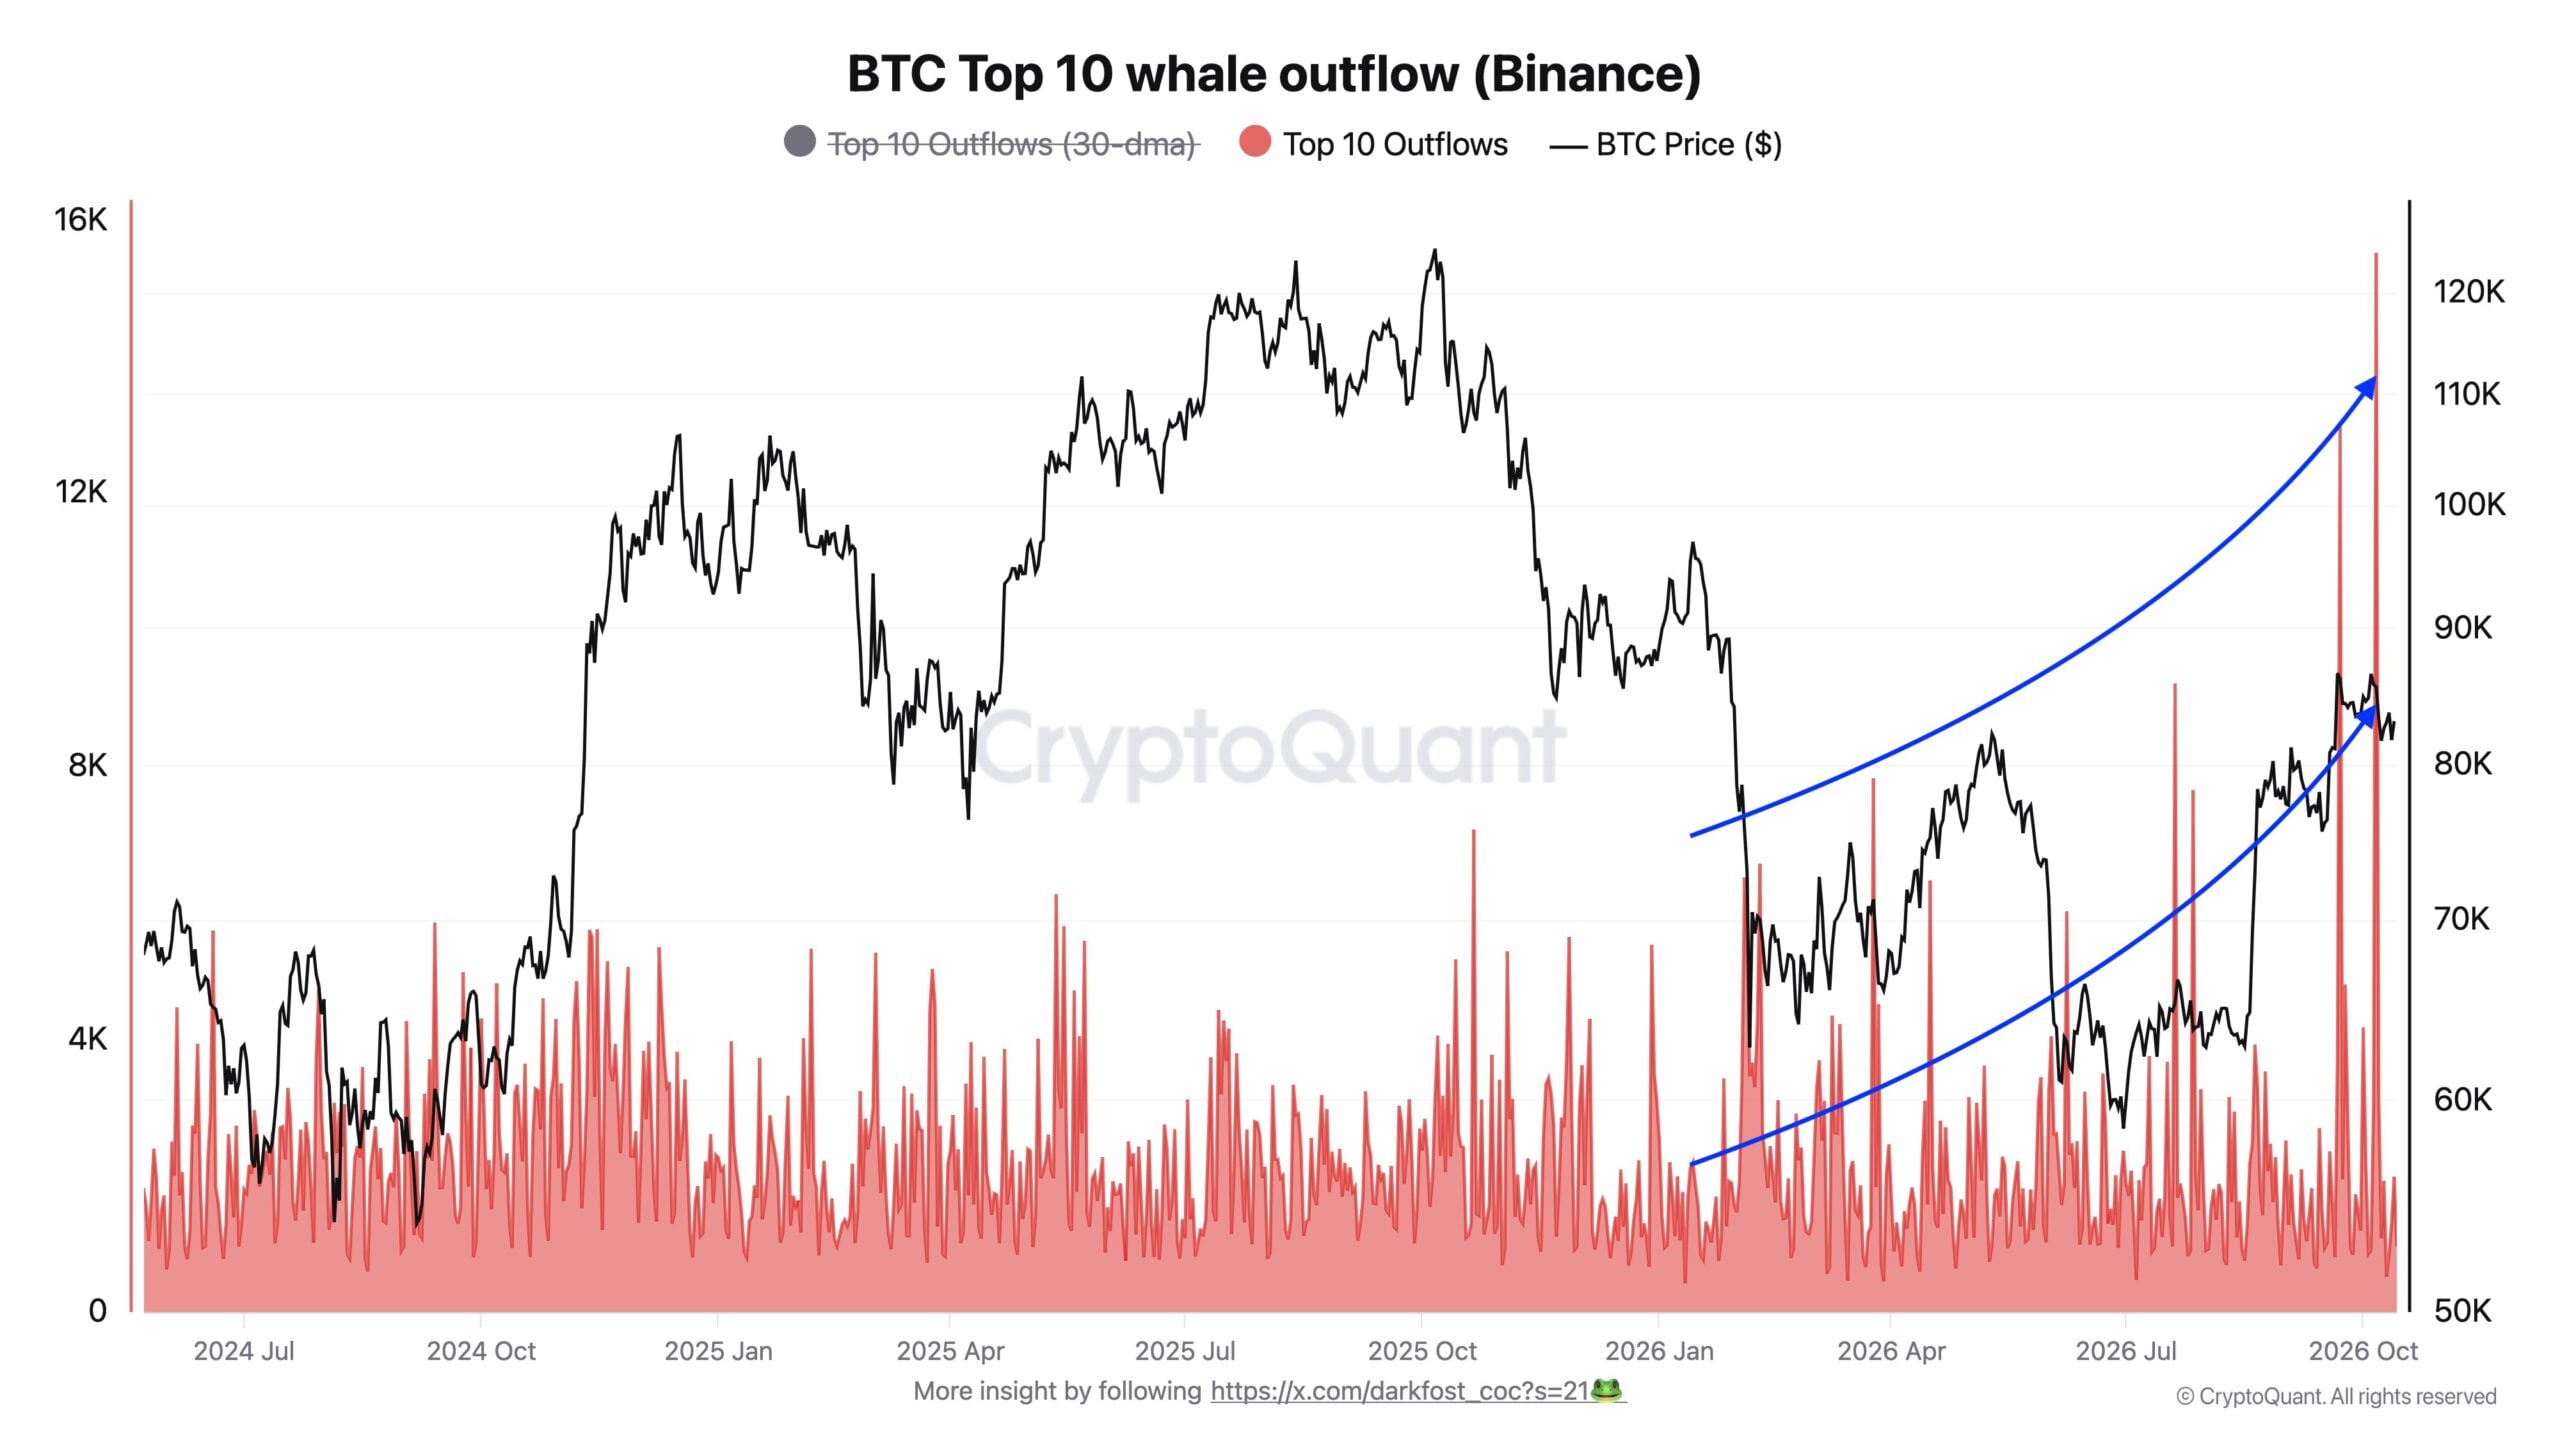
While ETFs are selling, the behavior of whales on centralized exchanges like Binance presents a more nuanced picture. CryptoQuant data shows a surge in daily outflows from the ten largest whales on Binance. During the market downturn in February, these whales were moving 6,000 to 8,000 BTC daily. Recently, that number has spiked to over 15,000 BTC, with monthly averages climbing from roughly 18,459 BTC in mid-August to nearly 30,000 BTC.
The critical question is: what are they doing with these coins? While removing coins from an exchange (off-exchange movement) is often interpreted as a bullish signal of long-term holding, it does not necessarily imply accumulation. It could signal a move to over-the-counter (OTC) desks or private wallets for distribution. If these whales are merely moving liquidity to avoid the volatility of exchange order books, the net effect on price remains neutral to bearish.
Implications for the Near-Term Market Outlook
The market is currently caught in a transition phase. Several key factors will determine whether Bitcoin can break through its current resistance or if it is destined for further consolidation.
1. Reduced Forced Selling
One positive metric from the current data is that realized losses among long-term holders have declined by 85% since their peak in late August. This suggests that the "capitulation phase" may be over; those who were forced to sell due to margin calls or panic have already exited. The remaining long-term holders appear more resilient, which could provide a solid floor for the price, provided that the current $81,500 support level holds.
2. The Battle of Liquidity
The immediate future depends on the net flow between ETF redemptions and whale accumulation. If ETF outflows continue to outpace the rate at which private investors and whales remove liquidity from exchanges, the price will likely remain range-bound or drift lower. For a sustainable recovery, the market requires a catalyst that shifts the ETF flows back into positive territory.
3. Psychological Thresholds
The $88,000 level is more than just a number; it is a psychological barrier for a massive cohort of buyers. If Bitcoin can convincingly break and hold above this price point, it would effectively "clear" the supply of underwater sellers, potentially leading to a renewed push toward all-time highs. Until then, the market will likely be characterized by high volatility and frequent rejections at the lower resistance levels.
Conclusion: The Path Ahead
Bitcoin’s trajectory is currently dictated by the conflict between institutional outflows and the cautious optimism of long-term holders. While the decline in forced selling is an encouraging sign of market maturity, the sheer weight of the "breakeven" crowd acts as a heavy anchor on price discovery.
Investors should remain wary of the correlation between ETF redemption cycles and price dips. As long as these funds continue to experience net outflows, the risk of a sustained, deeper correction remains elevated. A durable recovery will require more than just technical strength; it will necessitate a return of institutional confidence and a clearing of the supply overhang that currently haunts the market. For now, Bitcoin remains in a state of consolidation, waiting for the next major fundamental shift to dictate its direction.