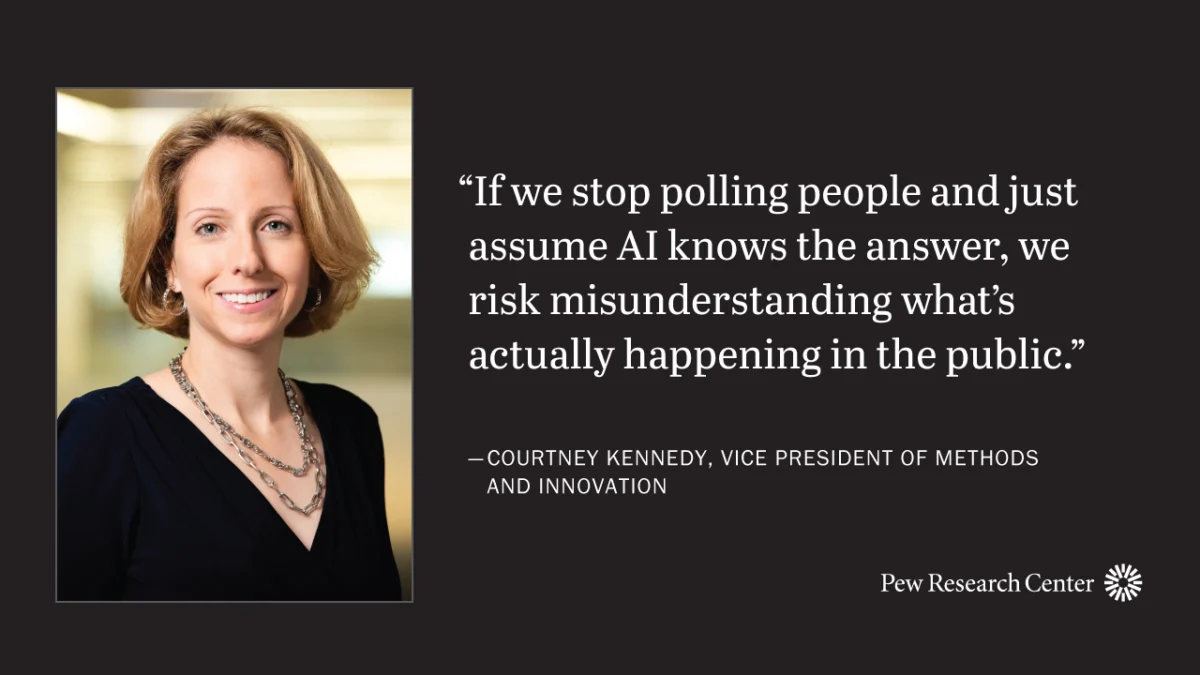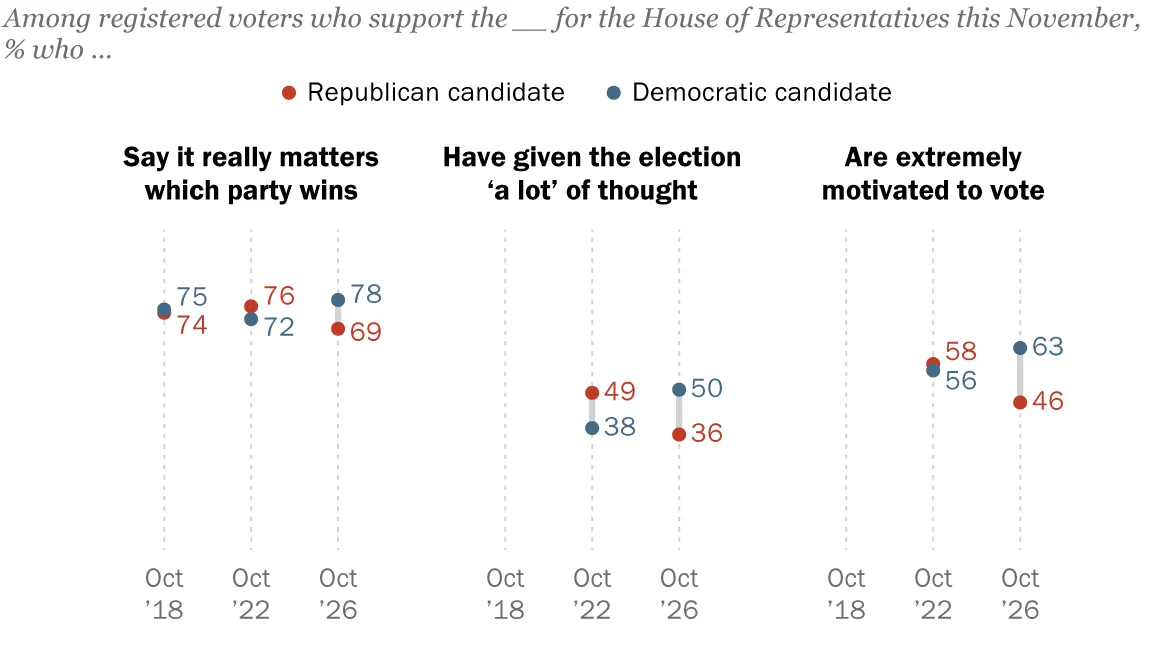
In the era of "big data," the challenge of capturing an accurate snapshot of the American public has never been more complex. As political, social, and economic landscapes shift with unprecedented speed, the methodology behind public opinion research serves as the bedrock of democracy’s information ecosystem. Pew Research Center’s Wave 200 of the American Trends Panel (ATP) stands as a case study in modern survey rigor, combining traditional polling discipline with contemporary technological adaptations.
Conducted between September 28 and October 4, 2026, this wave represents a significant effort to distill the sentiments of a diverse nation. By engaging a nationally representative panel of over 5,000 U.S. adults, the Center provides a window into the prevailing winds of public discourse, anchored by a methodological framework designed to minimize bias and maximize representativeness.
Main Facts: The Anatomy of a High-Stakes Survey
The integrity of any survey rests on its ability to minimize error while maximizing the participation of a truly random sample. Wave 200 of the ATP is defined by its scale and its adherence to stringent statistical standards.
- Sample Size and Reach: Out of 5,835 sampled panelists, 5,062 successfully completed the survey, resulting in a survey-level response rate of 87%. This high level of engagement is a hallmark of the ATP’s long-term relationship with its panelists.
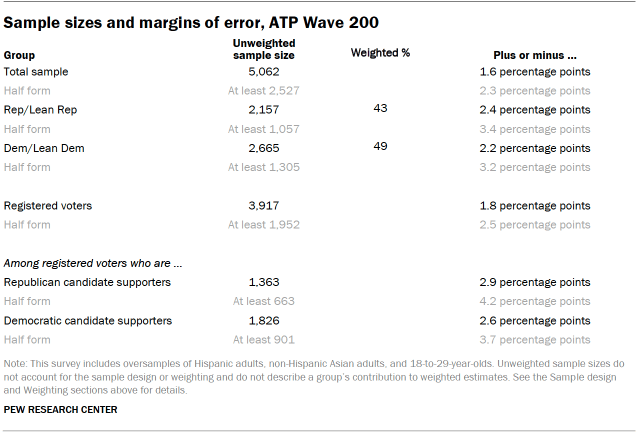
- Precision and Error: The margin of sampling error for the full sample sits at an impressive ±1.6 percentage points. This narrow margin provides researchers with the confidence to draw meaningful conclusions about the broader population.
- Oversampling Strategy: To ensure that the voices of traditionally underrepresented groups—specifically Hispanic adults, non-Hispanic Asian adults, and young adults aged 18 to 29—are heard with statistical clarity, the study utilized oversampling. These groups are later weighted back to their correct population proportions, ensuring the data remains representative of the total U.S. adult population.
- Methodological Versatility: While the vast majority of responses (4,874) were collected online, 188 interviews were conducted via live telephone, acknowledging the need for multi-modal access in a digital-first world. The survey was offered in both English and Spanish to accommodate linguistic diversity.
Chronology: The Lifecycle of a Wave
The development of a survey of this magnitude is a months-long endeavor that culminates in a week of intensive data collection. Understanding this timeline is essential for interpreting the results, as it highlights the layers of quality control embedded in the process.

Phase 1: Preparation and Recruitment
The foundation of the ATP was laid long before the September 2026 launch. Since 2018, the panel has utilized Address-Based Sampling (ABS), drawing from the U.S. Postal Service’s Computerized Delivery Sequence File—a database covering up to 98% of the U.S. population. This transition from older, less reliable random-digit-dial methods to ABS reflects the Center’s commitment to keeping pace with modern communication habits.
Phase 2: Design and Soft Launch
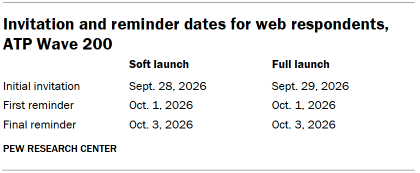
In the final weeks of September 2026, the questionnaire was finalized by Pew Research Center in collaboration with SSRS. Before the full-scale deployment, researchers conducted a "soft launch" on September 28. This pilot test involved a small group of 60 online panelists and a limited phone effort to ensure that the logic, randomization, and user interface functioned perfectly on both mobile devices and PCs.
Phase 3: Fieldwork and Engagement
The full survey period ran from September 29 to October 4. The engagement strategy was multi-pronged:
- Digital Outreach: Participants received email and SMS invitations, with up to two reminders sent to non-responders to boost completion rates.
- Telephone Outreach: Trained interviewers from SSRS utilized a system that allowed for up to six contact attempts, ensuring that the "hard-to-reach" demographics were given ample opportunity to participate.
- Incentive Structure: Recognizing the value of the participants’ time, the Center offered post-paid incentives ranging from $5 to $20. These were tiered based on the propensity of the participant to respond, a tactical choice intended to balance the sample and keep the panel healthy.
Supporting Data: Ensuring Data Integrity
The raw data generated by 5,062 respondents is only as valuable as the measures taken to scrub it of "satisficing"—the tendency of respondents to provide hurried, unthoughtful answers.
Rigorous Quality Control
Researchers performed an exhaustive review to identify patterned behavior, such as leaving questions blank or "straight-lining" (selecting the same answer for every question in a series). Through this process, eight respondents were excluded from the dataset entirely. This culling process is vital for maintaining the integrity of the final analysis.
The Role of Artificial Intelligence
In an era where open-ended questions can generate massive amounts of qualitative data, the use of AI-assisted text classification has become a necessity. However, the Center maintains a human-in-the-loop requirement: all AI-coded responses were reviewed, validated, and corrected by human researchers before being integrated into the final report. This "hybrid" approach ensures speed without sacrificing nuance.
Weighting: The Mathematical Equalizer
The raw sample is rarely a perfect reflection of the U.S. Census. To correct this, the Center applies a complex weighting process. Each panelist begins with a base weight reflecting their recruitment probability. This is then calibrated against population benchmarks and trimmed at the 1st and 99th percentiles to prevent outliers from skewing the results. This ensures that the findings reflect the U.S. population’s actual demographic composition rather than just the subset of people most likely to answer a poll.
Official Perspectives: The Value of the ATP
For the researchers at Pew Research Center, the ATP is more than just a list of numbers—it is an infrastructure of accountability. By publishing the methodology in such granular detail, the Center invites the public and the academic community to audit their process.
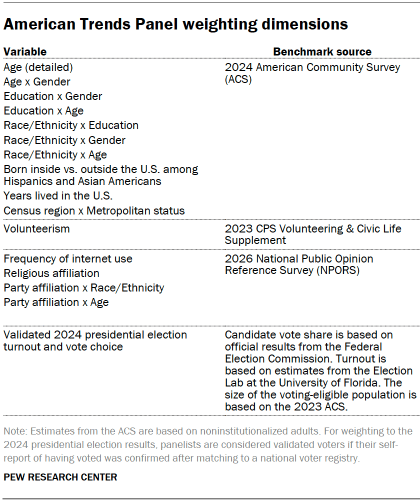
"The goal is not merely to capture a headline," noted a spokesperson for the project. "The goal is to provide a reliable, transparent record of how Americans are thinking, feeling, and living at a specific moment in time. When we disclose our oversampling, our weighting dimensions, and our data cleaning processes, we are inviting the reader to trust the work because they can see the work."
The transparency surrounding the response rates (a cumulative rate of 3%, reflecting the long-term attrition inherent in panel-based research) is a deliberate choice. It highlights the reality that modern polling is a difficult, resource-intensive task that requires constant maintenance to remain relevant.
Implications: The Future of Public Opinion Research
The implications of the Wave 200 methodology are far-reaching. As the decline of traditional landline phone service continues, the reliance on address-based sampling and multi-modal digital outreach will likely become the industry standard.
Addressing the "Response Bias" Problem
The success of this wave in maintaining high response rates—despite the general public’s growing "survey fatigue"—suggests that the ATP’s combination of incentives and professional recruitment is working. However, the reliance on these methods also highlights a critical challenge for the future: the cost of high-quality polling is rising. As researchers must work harder to reach diverse, tech-savvy, or skeptical populations, the financial and logistical investment required to produce a valid, representative poll is increasing.
Transparency as a Shield
In an age where "fake news" and misinformation circulate rapidly, the methodological rigor of the ATP serves as a bulwark against skepticism. By documenting every step—from the initial postcard notification to the final trimming of statistical weights—the Center provides a blueprint for how institutions can maintain authority in the public square.
The Path Forward
As we look toward future waves of the American Trends Panel, the lessons learned from Wave 200 will be instrumental. The successful integration of AI, the continued refinement of address-based sampling, and the unwavering commitment to human-led validation represent a synthesis of tradition and innovation. Ultimately, this survey is a testament to the fact that while technology changes, the fundamental need for accurate, representative, and transparent data remains the heartbeat of a functional democracy.
The data provided by the American Trends Panel does more than inform a news cycle; it provides the empirical evidence necessary for policymakers, sociologists, and citizens to understand the shifting tides of the American experience. As the methodologies evolve, the commitment to these core principles—rigor, transparency, and representativeness—will continue to define the standard for high-quality public opinion research.