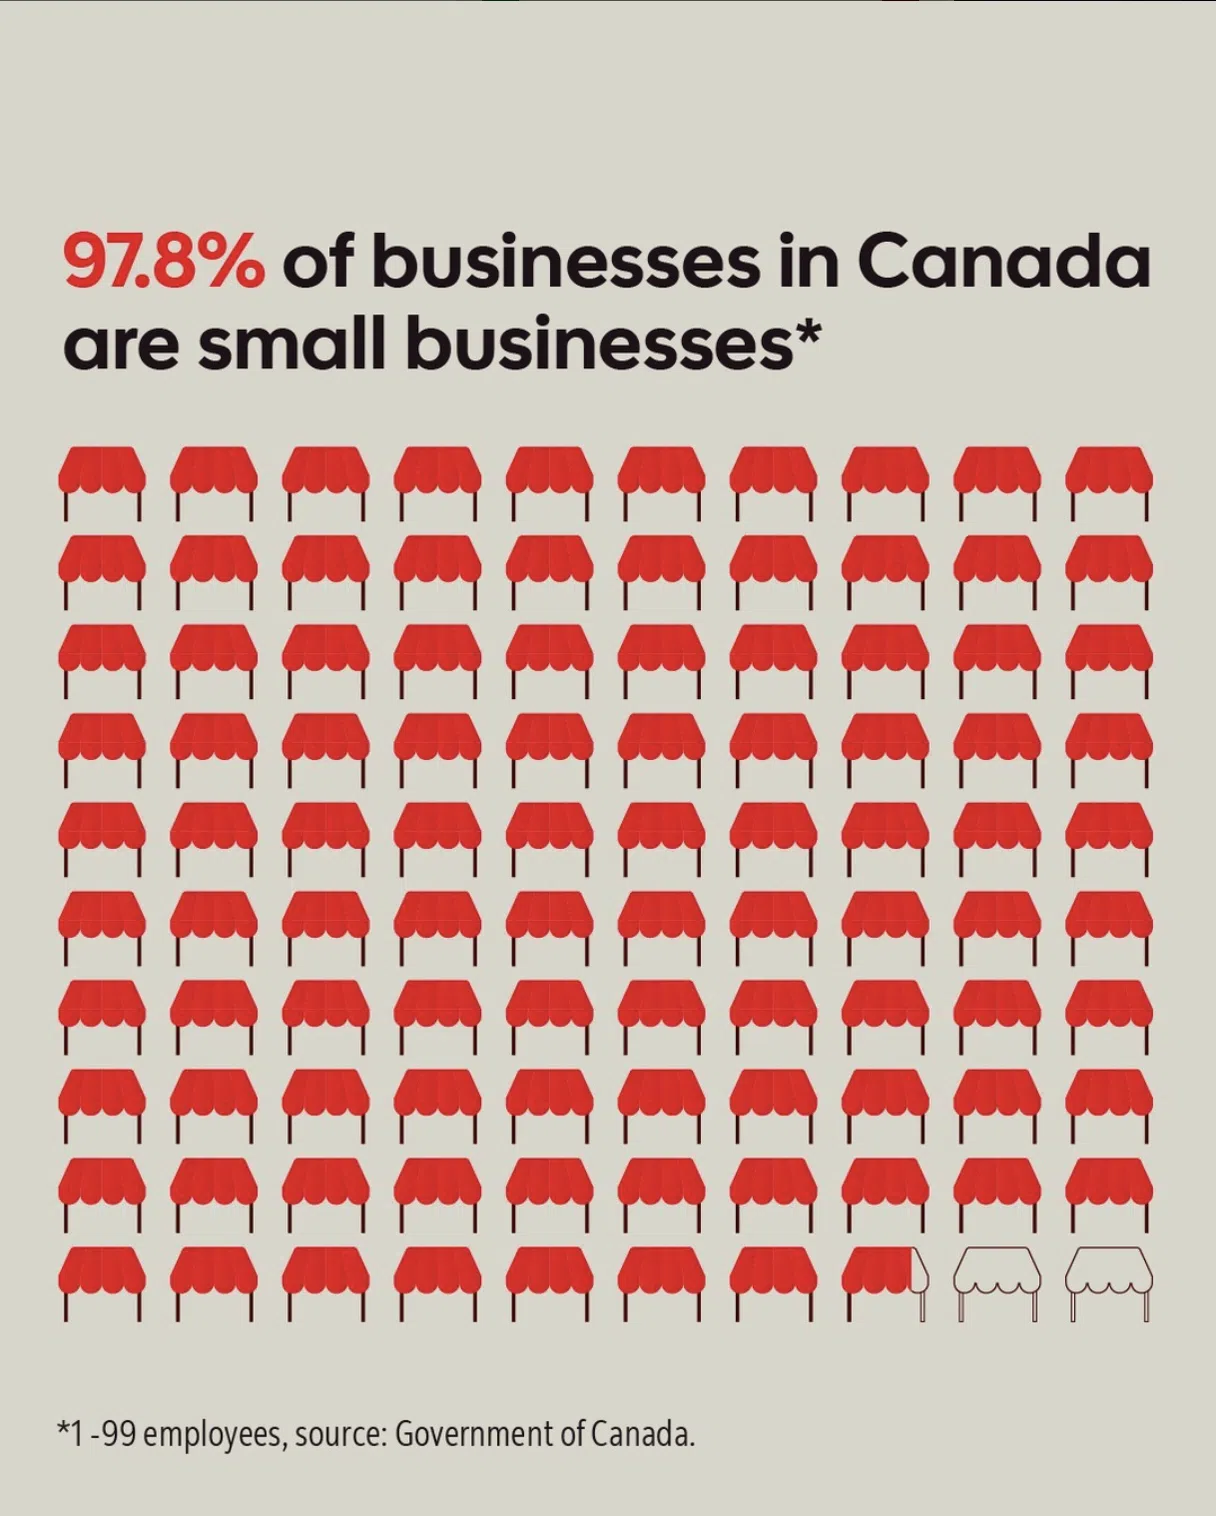
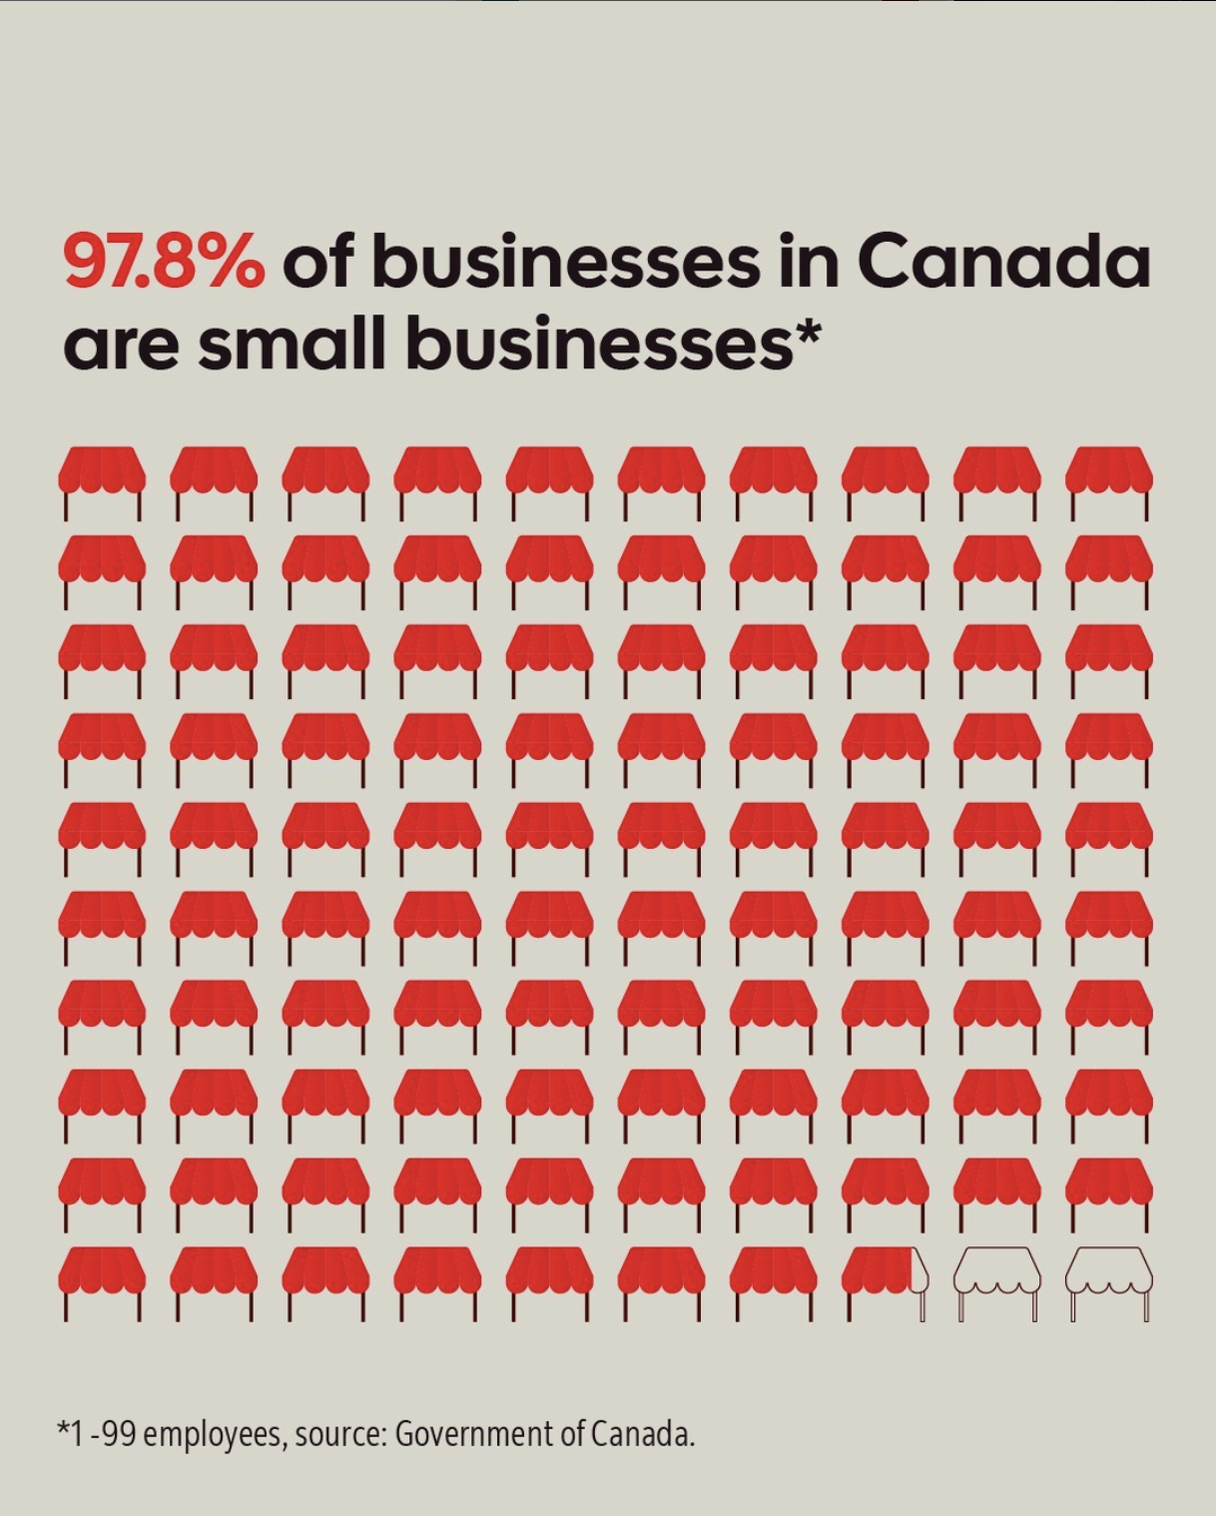
In an era where social media feeds are saturated with unverified opinions and ephemeral content, the most successful brands are pivoting toward a more substantive strategy: data storytelling. By transforming raw numbers into compelling narratives, marketers are finding a powerful way to bridge the gap between logic and emotion, building trust with audiences that are increasingly skeptical of hollow brand claims.
As digital landscapes become more competitive, the ability to synthesize facts, statistics, and quantitative information into a readable story is no longer just a "nice-to-have" skill—it is a cornerstone of modern brand authority.

The Foundation: What is Data Storytelling?
At its core, data storytelling is the practice of using quantitative information to construct a narrative that is both understandable and actionable. It does not merely present a spreadsheet; it breathes life into metrics to support a brand’s mission.
Leeann Froese, Digital Marketing Manager at Town Hall Brands, emphasizes that data is the ultimate equalizer in marketing. "Using data to tell stories from a brand’s point of view can be very effective, as it bridges that place between logic and emotion and lets a brand connect with a reader on a deeper level," she notes.

When executed correctly, data acts as a validator. Whether it is citing scientific research to prove a point or using customer survey results to demonstrate product efficacy, data provides the "receipts" that consumers demand. However, this power comes with a significant responsibility: the data must be accurate, unaltered, and sourced from reputable entities. In the social media age, where misinformation spreads at lightning speed, fabricating or manipulating statistics is a dangerous strategy that can lead to irreparable PR damage.
The Three Pillars: Data, Narrative, and Visualization
A successful data story relies on the synergy of three distinct elements: the information itself, the narrative arc, and the visual presentation. Removing any one of these pillars causes the content to collapse.
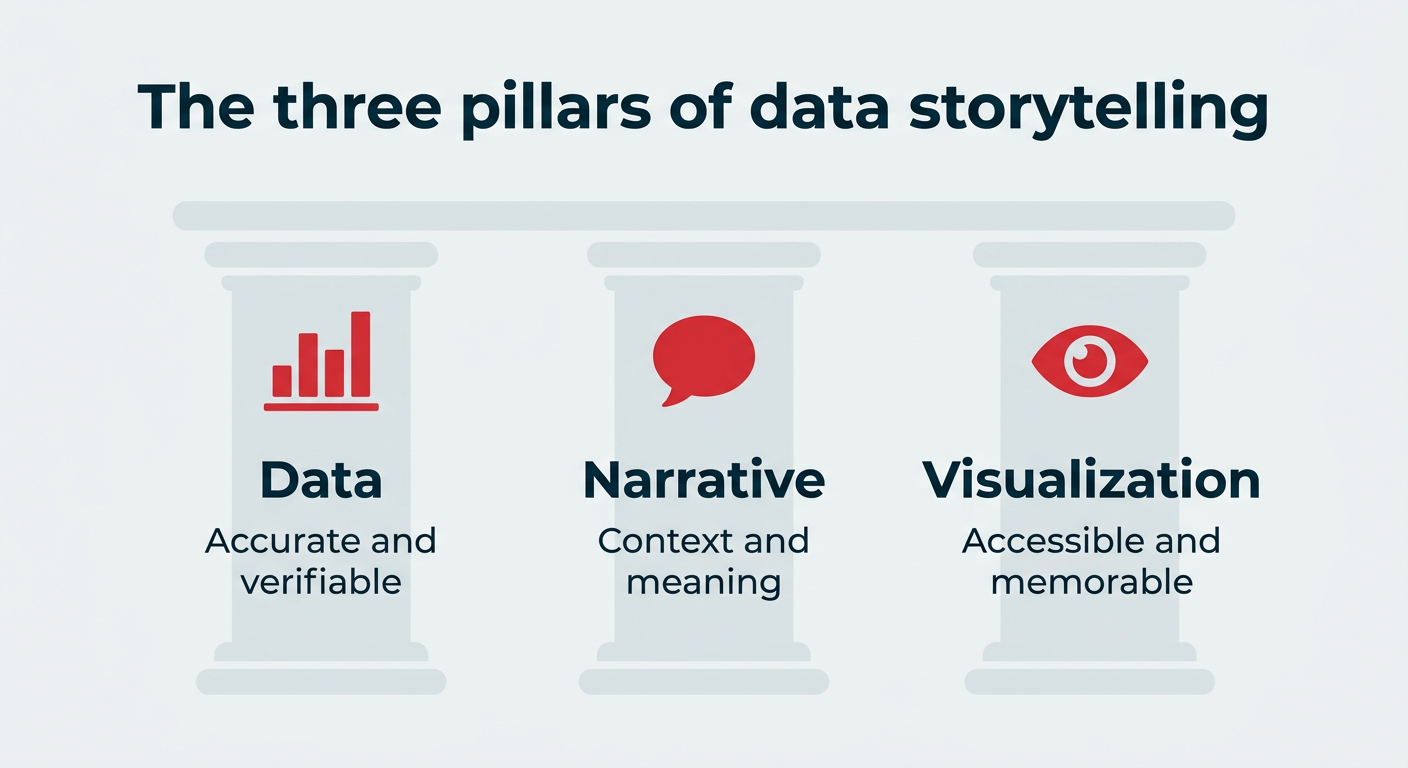
1. Data
The foundation is verifiable information. This can stem from third-party research, platform-native analytics, or first-party data gathered through sales and surveys. If a statistic cannot be traced to a credible source, it should not be part of the story.
2. Narrative
Narrative provides the "why." A 12% increase in engagement is merely a number until a marketer frames it within the context of changing consumer behaviors or a specific business challenge. The narrative provides the stakes—who is affected and what the audience should do next.
3. Visualization
In a feed designed for rapid scrolling, visuals are the gateway to engagement. As Froese points out, the brain processes visual data significantly faster than text. The format must match the message: bar charts for comparisons, line charts for trends, and carousels for multi-step explanations.
The 5 C’s Framework: Structuring the Arc
To ensure data-driven posts do not devolve into dry lists of figures, marketers should adopt the "5 C’s" framework. This classic narrative arc helps transform cold facts into a compelling journey:

- Context: Establishing the setting and explaining why this data matters now.
- Characters: Identifying who the story is about—your customers, community, or team.
- Conflict: Defining the gap, risk, or missed opportunity the data reveals.
- Climax: Presenting the headline statistic that shifts the perspective.
- Closure: Offering a clear takeaway or a call-to-action (CTA).
Implications: Why Data Storytelling Wins
The shift toward data-led content is a direct response to a changing digital environment. According to recent global research, nearly 79% of adults feel that social media has made it easier for people to be manipulated by false information. By arming content with data, brands provide an "extra layer of validity."
Furthermore, there is a clear performance benefit. As organic engagement rates fluctuate, meaningful, data-backed storytelling stands out as a "stop-the-scroll" tactic. It also simplifies the reporting process; instead of justifying ROI through vague metrics like "reach," marketers can show leadership exactly how a specific insight moved the needle for the business.
A Seven-Step Workflow for Data Storytelling
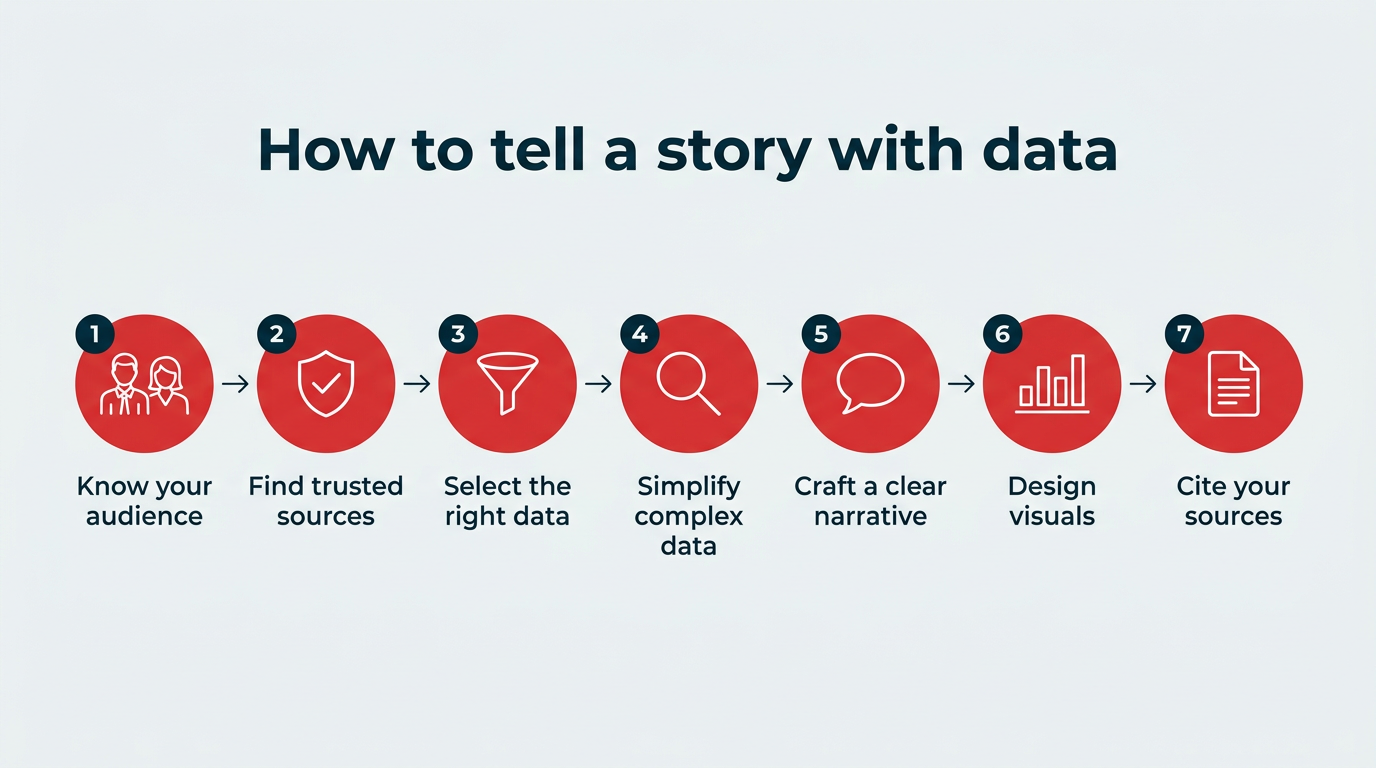
For teams looking to operationalize this approach, a structured process is essential:
1. Know Your Audience
Start by segmenting the audience. A finance-oriented persona will require methodology and raw figures, while a general consumer will respond better to a relatable analogy or a single, impactful headline stat.

2. Source Credibly
Avoid the trap of citing other social media posts. Rely on professional research, peer-reviewed studies, and verified internal analytics to maintain institutional credibility.
3. Curate Selectively
The goal is not to present a data dump. Much like Pinterest’s trend reports, effective storytelling involves selecting the specific points that illuminate a larger narrative.

4. Simplify with Analogies
Large, abstract numbers are difficult to process. Instead of stating "10,000 liters of production," use an analogy: "enough to fill 10,000 glasses."
5. Weave the Narrative
Once the data is chosen, frame it within the 5 C’s. Use the numbers to bolster the message, not to substitute for it.

6. Design for the Feed
Ensure your visuals are optimized for mobile. Avoid complex 3D effects that distort proportions. Keep the design clean and focused on one primary message per graphic.
7. Practice Transparency
Always cite your sources. If you feel uncomfortable sharing where the data came from, it is a sign that the data may not be robust enough for public consumption.

Case Studies in Success
Several brands have successfully mastered this craft. Impact has built a massive following by pairing hard-hitting statistics about social issues with bold, carousel-based visual design. By ending their posts with a question, they transform passive viewers into active participants in the conversation.
Farmers Pick demonstrated the power of the "data hook" in a viral TikTok regarding food waste. By leading with the startling figure of "1,500 kgs of rejected zucchinis," they immediately captured viewer attention and used the video to explain the "why" behind the waste, resulting in massive engagement.

Dove’s "Hard Knocks" campaign highlights a different approach: using data as a "reality check" at the end of an emotional narrative. By presenting the statistic "45% of girls quit sports by age 14" after the audience is already emotionally invested in the characters, the data carries much more weight.
Avoiding Common Pitfalls
Even with a strong strategy, marketers often stumble. Common mistakes include:
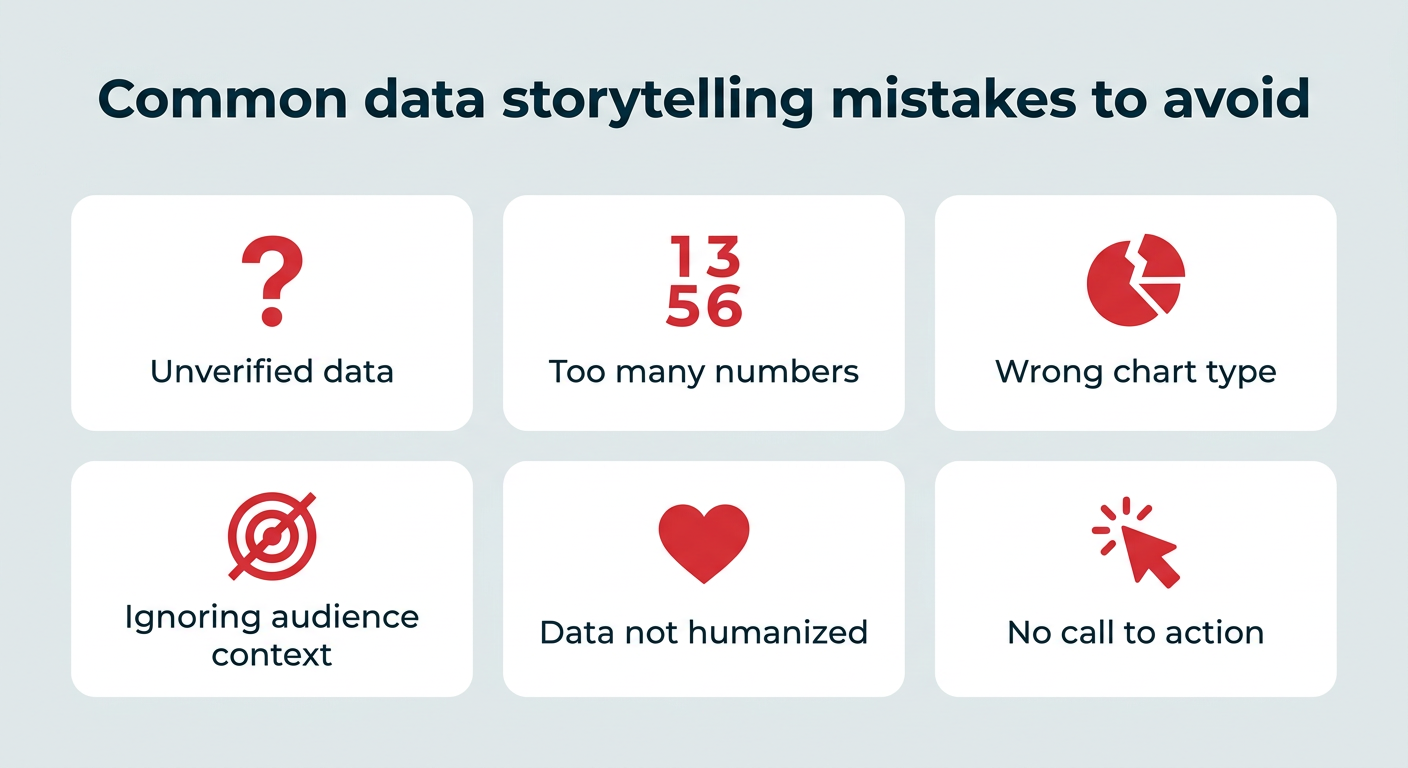
- Overwhelming the audience: Including too many data points in a single graphic.
- Misleading visualizations: Using charts that distort proportions or make comparisons difficult.
- Lack of a Call to Action: Failing to tell the audience what to do with the information provided.
- Poor Sourcing: Relying on unverified "internet facts" that damage brand reputation.
Conclusion: The Future of Brand Authority
Data storytelling is not a passing trend; it is the natural evolution of content marketing. As the digital space becomes more crowded, the brands that win will be those that can cut through the noise with facts that matter.
By utilizing the three pillars of data, narrative, and visualization—and grounding every post in the 5 C’s framework—marketers can move beyond surface-level engagement. They can build a lasting, authoritative voice that educates, inspires, and ultimately converts. Whether you are using a comprehensive dashboard to track real-time insights or simply refining your next Instagram carousel, the strategy remains the same: treat data as a gift, not just a number, and your audience will thank you with their loyalty.