The American freight landscape is currently navigating one of its most paradoxical periods in recent memory. As we move into the fourth quarter of 2026, the data emanating from the nation’s supply chain networks is presenting a classic "tug-of-war" scenario. Industry observers and logistics professionals are grappling with a market that, on the surface, appears to be cooling in terms of demand, yet is simultaneously witnessing a sharp, aggressive climb in spot market pricing.
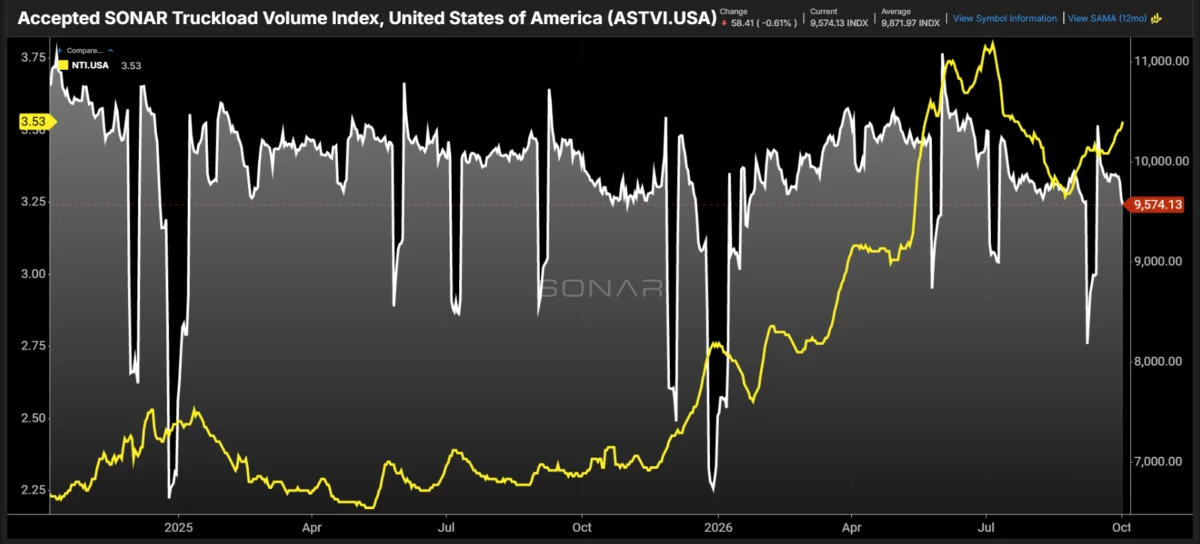
According to the latest insights from the FreightWaves SONAR platform, the Accepted Truckload Volume Index (ASTVI)—a primary barometer for the volume of contracted freight accepted by carriers—has retreated nearly 3% over the past week, landing at 9,574. This figure places national freight volumes below the 12-month average of 9,872, signaling a potential softening in the underlying demand for truckload services. However, in a move that defies traditional market logic, the National Truckload Index (NTI), which tracks dry van spot rates inclusive of fuel, has surged to $3.53 per mile. This represents a staggering 10% increase from late August lows and stands approximately 50% higher than the same period last year.
A Chronology of Market Turbulence
To understand how we arrived at this disconnect, one must look at the progression of market indicators throughout the third quarter. September began with a fragile equilibrium. Carriers were operating under the assumption that the high-water mark for demand had passed, yet they remained cautious regarding capacity.
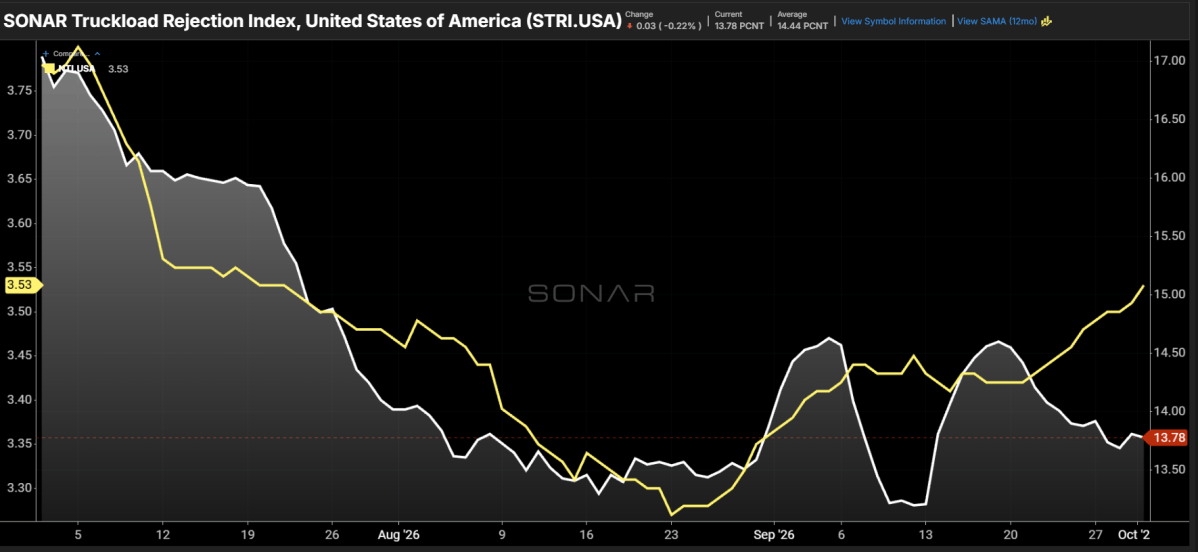
By September 19, tender rejection rates—the percentage of contracted loads that carriers turn down, typically in search of higher-paying spot market opportunities—stood at 14.6%. In a healthy, balanced market, this level suggests a moderate degree of tightness. However, by October 1, that figure had receded to 13.78%.

Usually, when both accepted tender volumes and rejection rates fall in tandem, it is a clear indicator that the market is loosening. Logic dictates that when capacity is readily available and shippers are not being turned away by their contracted carriers, spot rates should soften due to reduced competition for available trucks. Instead, the inverse occurred. The divergence between falling rejection rates and rising spot rates has persisted for the majority of September, confounding analysts who are accustomed to seeing these metrics move in lockstep.
Analyzing the Data: Why the Disconnect?
The current market environment challenges the standard economic models often applied to logistics. Typically, the relationship between contract tenders and spot rates is dictated by lead times. Contracted tenders are generally placed with several days of lead time, whereas spot market loads are reactive, often requiring pickup within 24 to 48 hours.
While it is common for tender volume indices to lead spot market trends by a few days, this current gap has extended into a multi-week phenomenon. Several hypotheses have been put forward to explain why this disconnect persists:
- The "Sticky" Rejection Floor: Even at 13.78%, rejection rates remain historically elevated. While they have come down from the peak of the month, they remain high enough to prevent a total collapse in spot rates. Shippers may be seeing fewer rejections, but they are still not seeing the abundance of capacity that would allow them to dictate pricing in the spot market.
- The Fuel Inflation Trap: Perhaps the most compelling explanation for the current pricing environment is the aggressive spike in diesel costs throughout September. Unlike general economic trends, fuel costs operate on an immediate impact basis. For a carrier, rising fuel costs are an "above-the-line" expense that must be addressed immediately to preserve margins.
- The Lag Effect in Cost Recovery: Because many carriers operate on delayed payment cycles—often waiting weeks after delivery to be compensated—rising fuel prices create an immediate liquidity crisis. Carriers are forced to raise their spot rates to cover the immediate cash outlay for fuel, even if the overall volume of freight in the network is waning.
The Role of Operating Costs in Market Pricing
It is vital to distinguish between a "tight" market driven by high demand and a "tight" market driven by high operating costs. As fuel prices climbed sharply through September, the pressure on carrier cash flows intensified.
Historically, fuel prices and spot rates have not always shared a linear correlation. There have been periods where rates rose while fuel fell, and vice versa. However, when fuel prices rise as rapidly as they did in the last month, the cost of entry to participate in the spot market rises for every carrier. Even as demand slips, the existing market conditions—coupled with the high cost of fuel—allow carriers to push back against shippers.
This indicates that we are not necessarily seeing a market that is getting tighter in terms of freight availability. Rather, we are seeing a market where the "cost floor" has been reset. Carriers are passing fuel cost inflation through to shippers simply to survive. If they cannot cover their fuel expenses, they cannot afford to run the truck. Consequently, the rising NTI is less a reflection of high consumer demand and more a reflection of the inflationary pressures on the transportation sector’s supply chain.
Implications for Shippers and Carriers
For shippers, this period represents a high-risk environment. The fact that spot rates are rising despite a decline in volume suggests that the market is sensitive to cost shocks. Shippers who rely heavily on the spot market for overflow capacity may find themselves paying a premium that is not entirely justified by the underlying volume, but rather by the carrier’s need to recoup fuel expenditures.
For carriers, the current climate requires extreme discipline. While the ability to pass through costs is a sign of a resilient sector, the decline in tender volumes suggests that a broader economic cooling could be on the horizon. Carriers that over-leverage their operations based on current spot rates may find themselves in a precarious position if fuel costs remain high while volume continues to trend toward the 12-month average.
Navigating the Future: Industry Events and Strategy
As the industry prepares for the final months of the year, the conversation is shifting toward resilience and compliance. The upcoming Brokerage Compliance Symposium on October 26, 2026, in Chattanooga, Tennessee, highlights the increasing focus on the regulatory and operational hurdles facing the industry. Topics ranging from fraud exposure and carrier liability to cargo theft and insurance gaps are more relevant than ever in a volatile rate environment.
Following the symposium, the F3: Future of Freight Festival will bring together industry leaders to discuss these exact market dynamics. The event serves as a focal point for the sector to analyze the intersection of technology and market volatility. With the F3 Awards Dinner honoring the top 100 FreightTech companies, the focus remains on how data-driven decision-making can help firms navigate the "mixed signals" currently present in the market.
Conclusion
The divergence between the Accepted Truckload Volume Index and the National Truckload Index is a stark reminder that the freight market is never a simple reflection of supply and demand. It is a complex ecosystem where fuel prices, payment cycles, and operational liquidity play as large a role as the actual physical movement of goods.
As we look toward the remainder of 2026, the primary question for stakeholders will be whether the current spot rate surge can be sustained if volumes continue to trend downward. If fuel prices stabilize, we may see a correction in the NTI. If they continue to climb, the industry may face a period of sustained high rates that could dampen consumer spending, creating a feedback loop that neither shippers nor carriers desire. For now, the best strategy for all participants is to remain closely tethered to real-time data, avoiding the trap of assuming that traditional historical patterns will repeat in a landscape altered by significant inflationary pressures.