In an era where artificial intelligence, advanced analytics, and automated decision-making systems drive the corporate agenda, the adage "garbage in, garbage out" has never been more relevant. Organizations are increasingly recognizing that their competitive advantage is inextricably linked to the reliability of their data. However, data quality is not an abstract goal; it is a measurable discipline.
Data quality metrics serve as the definitive barometer for whether data is truly "fit for purpose." By shifting from anecdotal observations to quantitative rigor, companies can move beyond mere data storage to true data mastery. This guide explores the framework for implementing effective data quality metrics, the dimensions of measurement, and the strategic path to turning raw data issues into actionable business improvements.
The Core of Data Quality: From Requirements to Measurement
At its most fundamental level, data quality measurement is the process of quantifying the performance of specific data sets, elements, or processes against predefined business requirements.
The Methodology of Measurement
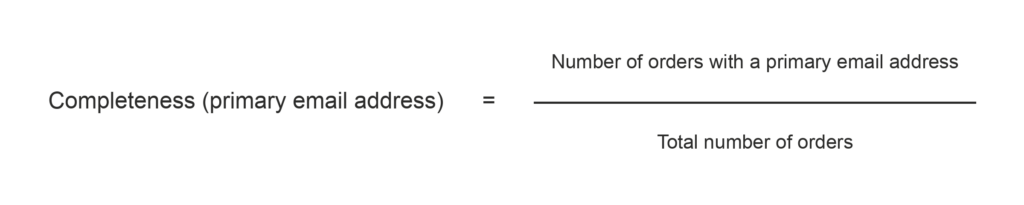
Measurement begins not with the technology, but with the use case. Consider a B2B e-commerce firm processing thousands of daily transactions. A critical requirement for their customer database is that every order must be associated with a valid, primary email address to facilitate order confirmation and customer communication.
To turn this requirement into a metric, the organization must classify it within a specific data quality dimension—in this case, completeness. By calculating the ratio of orders containing a primary email address against the total volume of orders, the company gains a percentage-based score (0% to 100%) that provides an immediate, objective view of data health.

Defining Rules, Checks, and KPIs
The technical execution of this measurement relies on a clear hierarchy:
- Business Rule: A testable condition (e.g., "The primary email field must not be null").
- Data Check: The execution of the rule via SQL, Python, or specialized data quality software. The check returns a binary value (0 or 1) for each record.
- Metric: The aggregation of these checks across the entire population.
- Key Performance Indicator (KPI): When a metric tracks a business-critical objective—such as the share of invalid customer records—it transcends technical reporting and becomes a KPI used for management-level steering.
The Taxonomy of Data Quality Dimensions
To build a comprehensive data quality program, practitioners must understand the seven primary dimensions that provide the structure for diagnosing data issues:
- Accuracy: The degree to which data correctly describes the "real-world" object or event.
- Completeness: The extent to which all required data is present.
- Consistency: The absence of contradiction between different parts of a system or across multiple systems.
- Timeliness: The degree to which data is available and up-to-date at the moment it is needed.
- Validity: The extent to which data follows a defined format, syntax, or business rule (e.g., a phone number containing only digits).
- Uniqueness: Ensuring that no entity is represented more than once within the data set.
- Relevance: The extent to which the data actually supports the specific business use case.
These dimensions are not universal; they are context-dependent. A recent BARC survey on Managing Unstructured Data (2026) revealed that when asked about measuring the AI readiness of data, 54% of respondents prioritized accuracy, while 31% focused on timeliness. This highlights that the "right" metric depends entirely on the business objective.
Establishing a Strategic Framework for Critical Data
For business-critical data, organizations must be methodical in their selection of metrics. The process should follow a rigorous sequence:
- Define the Business Goal: Identify the decision or process that relies on the data (e.g., financial reporting, customer personalization, or AI model training).
- Map Critical Data Elements (CDEs): Pinpoint the specific fields that, if corrupted, would cause the most significant business harm.
- Assign Dimensions: Determine which quality dimensions most directly impact those CDEs.
- Define Thresholds: Set the acceptable "tolerance" for error.
- Assign Responsibility: Every metric must have a designated data steward who owns the quality of that specific data set.
Setting Baselines, Targets, and Thresholds
A metric without context is merely a number. To make data quality actionable, organizations must establish a baseline, a target, and an escalation threshold.

The Dangers of "Notification Fatigue"
A common pitfall in data quality management is the over-alerting of stakeholders. If a data steward receives 20 irrelevant alerts every morning, they will eventually become desensitized to the system, potentially ignoring a critical failure.
To avoid this, thresholds should be tiered:
- Warning Threshold: A minor deviation that requires a check during routine maintenance.
- Escalation Threshold: A significant drop in quality that requires an immediate, predefined response to prevent downstream damage to business processes.
The Evolution of Data Observability
Modern data estates are increasingly complex. As organizations move toward continuous measurement, the industry is adopting "data observability"—a concept borrowed from IT system monitoring.
Data observability treats the data flow like machine telemetry. By monitoring data pipelines for anomalies, drift, and periodic patterns, teams can identify degradation before it hits a threshold. As noted in BARC’s research on Observability for AI Innovation, this proactive stance is becoming the standard for enterprises that cannot afford the downtime or decision-errors caused by poor-quality data.
Implications for the Future: AI and Beyond
The role of data quality is shifting from a back-office IT task to a boardroom-level priority. As AI models become more pervasive, the requirement for high-quality data becomes even more acute. AI systems are notorious for amplifying underlying data biases and errors; thus, the quality of training data is now a matter of regulatory compliance and corporate reputation.
The Changing Landscape
The BARC Data, BI, and Analytics Trend Monitor has consistently ranked data quality management as a top priority for years. This persistent focus reflects the ongoing struggle organizations face in maintaining reliable data-driven decision-making.
The industry is currently witnessing a transition where data quality is being integrated into the "Data Product" lifecycle. Rather than being an afterthought, data quality is increasingly "baked in" to the creation and delivery of data products, with automated testing and continuous monitoring serving as the foundation of modern data governance.
Conclusion: Turning Metrics into Action
Defining metrics, thresholds, and notifications is only the beginning. The ultimate value of a data quality program lies in its ability to influence business outcomes. Organizations must ensure that their metrics are linked to the Data Quality Management Lifecycle, which organizes the people, processes, and technologies necessary to remediate errors and prevent their recurrence.
As companies continue to navigate the complexities of digital transformation, the ability to measure—and effectively manage—data quality will separate the leaders from the laggards. By adopting a pragmatic approach to dimensions, investing in modern observability, and fostering a culture of data stewardship, businesses can ensure their data remains a reliable asset rather than a hidden liability.
FAQ: Navigating Data Quality Challenges
What exactly is a data quality metric?
A data quality metric is a quantifiable measure of how well a specific set of data satisfies the requirements of a business process. It is derived from rules (conditions) and checks (tests) that evaluate the data against defined dimensions like completeness or accuracy.
How do I decide which data quality dimensions to prioritize?
The priority is dictated by the use case. If you are training an AI model, accuracy and completeness are usually paramount. If you are operating a real-time supply chain system, timeliness and validity are likely more critical. There is no one-size-fits-all hierarchy.
What is the difference between a rule, a check, and a threshold?
- Rule: The business logic (e.g., "Postcodes must be 5 digits").
- Check: The actual technical execution of that rule on a data record.
- Threshold: The predefined boundary for the metric, used to determine when a human must intervene or when a system alert should be triggered.
How should we handle threshold setting?
Thresholds should be set based on the business impact of failure. Calculate the cost of the error in terms of revenue, operational risk, and compliance. Use these figures to determine the "point of pain" at which the business can no longer tolerate the current quality level.
Why is data quality management considered "changing"?
The shift is driven by the move from batch-oriented, manual reporting to real-time, AI-driven, and automated data pipelines. As the speed of business increases, the "window of opportunity" to detect and fix data errors has shrunk, necessitating the adoption of automated observability tools and a product-centric approach to data management.