As the calendar turns toward mid-January 2026, market participants are bracing for a high-stakes week of economic data releases. Investors and policymakers alike are keenly focused on whether the cooling trends observed in late 2025 will persist into the new year. The upcoming schedule is heavy on "tier-one" data points—most notably the December Consumer Price Index (CPI), retail sales, and a concentrated batch of housing market reports that will provide a clearer picture of the American consumer’s health and the resilience of the residential real estate sector.
Main Facts: The Week Ahead
The economic agenda for the week of January 11, 2026, is dominated by three primary pillars of the U.S. economy: inflation, consumer spending, and the housing market.
Tuesday kicks off the volatility with the December CPI report, a primary indicator for Federal Reserve monetary policy. Following this, the mid-week period offers a deep dive into domestic consumption via November retail sales, while the week concludes with a comprehensive look at the manufacturing sector and homebuilder sentiment. Analysts expect these reports to either confirm a "soft landing" scenario or highlight emerging cracks in the labor market and consumer demand as interest rates remain a focal point of debate.

Chronology of Economic Releases
Monday, January 12th
The week begins quietly, with no major economic releases scheduled. Market participants will likely use this time to adjust portfolios in anticipation of Tuesday’s inflation figures.
Tuesday, January 13th
- 6:00 AM ET: NFIB Small Business Optimism Index (December): This survey will offer a window into the mood of Main Street, highlighting whether small business owners feel confident enough to expand operations or increase hiring.
- 8:30 AM ET: Consumer Price Index (December): The headline event of the week. Consensus forecasts suggest a 0.3% monthly increase in both the headline and core CPI. Year-over-year, both metrics are expected to rise by 2.7%, a figure that will be scrutinized for signs of sticky inflation.
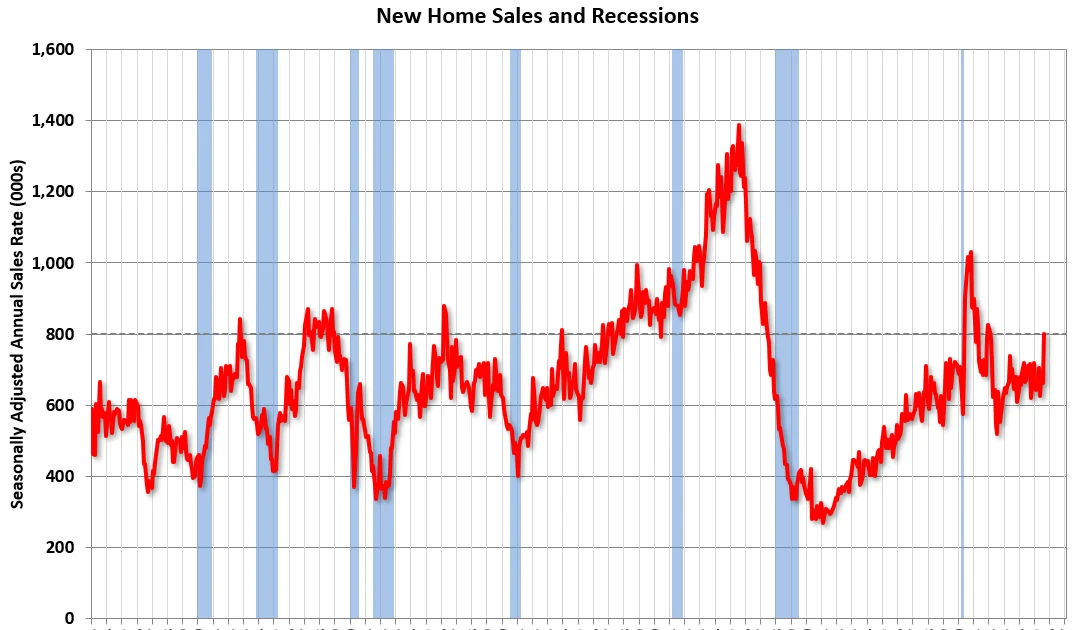
- 10:00 AM ET: New Home Sales (September and October): The Census Bureau is set to release a backlog of data. The market is looking for a Seasonally Adjusted Annual Rate (SAAR) of 714,000 for October, reflecting how high borrowing costs have pressured prospective buyers.
Wednesday, January 14th
- 7:00 AM ET: MBA Mortgage Purchase Applications Index: Providing a two-week overview, this index serves as an early warning system for housing demand trends.
- 8:30 AM ET: Producer Price Index (PPI) (December): Investors will examine the PPI for early signals of cost-push inflation in the supply chain. Expectations are for a 0.3% increase in the headline figure and a 0.2% increase in core PPI.
- 8:30 AM ET: Retail Sales (November): A critical test of the holiday shopping season’s momentum. A projected 0.4% increase would indicate that the American consumer remains resilient despite elevated prices.
- 10:00 AM ET: Existing Home Sales (December): The National Association of Realtors (NAR) report is expected to show a rise to 4.23 million SAAR, up from 4.13 million. This data is essential for assessing the "lock-in" effect that has hampered housing inventory.
- 2:00 PM ET: Federal Reserve Beige Book: This anecdotal report from the twelve Federal Reserve districts provides a granular look at regional economic conditions, often influencing market expectations for future rate adjustments.
Thursday, January 15th
- 8:30 AM ET: Initial Weekly Unemployment Claims: With a consensus of 208,000, this report will be monitored for any signs of an unexpected uptick in labor market cooling.
- 8:30 AM ET: Empire State Manufacturing Survey (January): A key regional pulse check. Analysts are looking for a reading of 1.0, a modest improvement from the previous month’s -3.9.
- 8:30 AM ET: Philly Fed Manufacturing Survey (January): Another critical manufacturing indicator. A projected improvement to -5.0 from -10.2 would signal a slow but steady stabilization in regional industrial activity.
Friday, January 16th
- 9:15 AM ET: Industrial Production and Capacity Utilization (December): The Fed will report on factory output. A projected 0.2% increase suggests a slight uptick in industrial momentum, with capacity utilization expected to hold steady at 76.0%.
- 10:00 AM ET: NAHB Homebuilder Survey (January): With a consensus reading of 40, this index remains below the critical 50-point threshold, underscoring that the majority of builders still view current market conditions as "poor."
Supporting Data: Understanding the Trends
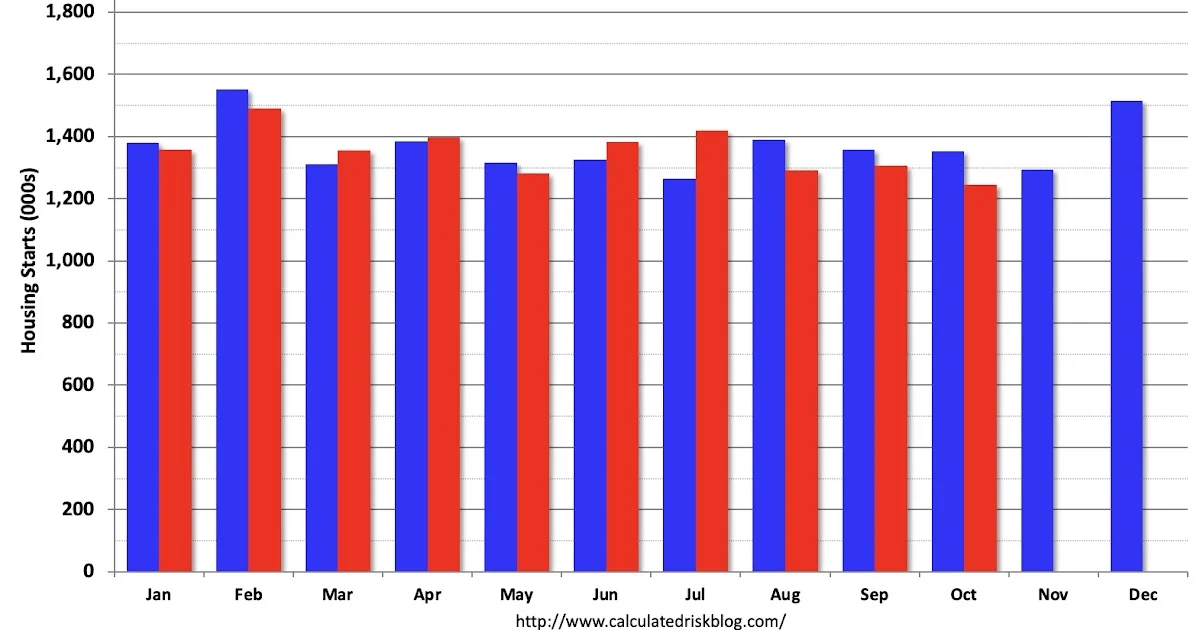
The data provided for this week does not exist in a vacuum. By analyzing the long-term charts for New Home Sales, Retail Sales, and Industrial Production, observers can see a pattern of stabilization following the turbulent post-pandemic era.
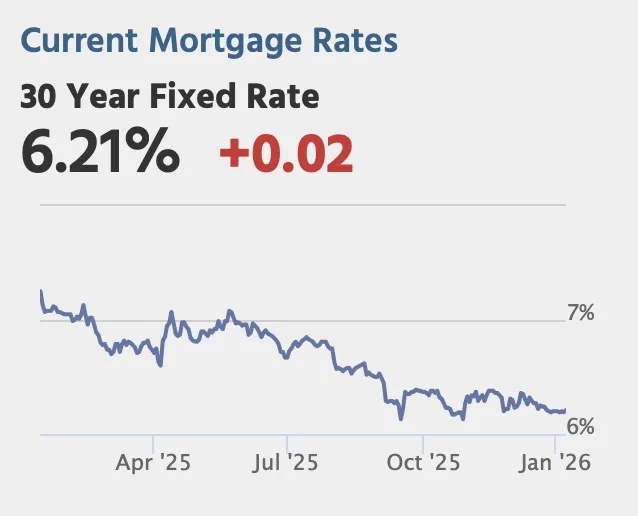
The housing market, in particular, remains in a state of suspended animation. With existing home sales struggling to find momentum and new home sales tracking against a baseline of historical averages, the industry is grappling with the dual challenge of high mortgage rates and low supply. Similarly, retail sales charts since 1992 reveal that while consumption remains elevated in nominal terms, the "ex-gasoline" figures are vital for understanding the true volume of consumer activity.

Official Responses and Federal Reserve Context
The release of the Federal Reserve’s Beige Book on Wednesday afternoon is perhaps the most significant "official" component of the week. While the CPI and PPI provide the quantitative data necessary for the Fed’s dual mandate of price stability and maximum employment, the Beige Book offers the qualitative narrative. It captures the boots-on-the-ground sentiment of bankers, business leaders, and community stakeholders.
Market watchers will be searching the text for specific keywords regarding labor shortages, wage growth, and the ability of businesses to pass on costs to consumers. If the Beige Book suggests that inflationary pressures are becoming embedded in the service sector, it may counteract any positive news from the CPI report.
Implications: What Does This Mean for the Market?
The implications of this week’s data are far-reaching. If the CPI prints higher than the 0.3% expectation, we can expect bond yields to spike and equity markets to experience heightened volatility as traders price in a more "hawkish" Federal Reserve. Conversely, a cooling of inflation, paired with resilient retail sales, would bolster the case for a soft landing.

Furthermore, the manufacturing surveys (Empire State and Philly Fed) and the NAHB housing index act as leading indicators for the broader economy. If these manufacturing indices show a return to positive growth, it could signal that the U.S. economy is successfully rotating away from a consumption-heavy model toward a more balanced, production-oriented recovery. However, the persistently low NAHB reading suggests that the housing sector—historically a major engine of growth—will remain a drag on the economy for the foreseeable future.
For the average household, this week’s reports are more than just numbers on a screen; they represent the economic reality of the coming year. Whether it is the cost of groceries reflected in the CPI or the potential for job stability hinted at in the unemployment claims, the data will define the fiscal landscape for the first quarter of 2026.
Investors should remain cautious. The consensus estimates provided are merely expectations, and in the current environment, the margin for error is slim. As the week unfolds, market participants must reconcile these various, sometimes conflicting, signals to gauge where the U.S. economy is truly headed in this complex post-inflationary cycle.