By Financial News Analysis Desk
January 9, 2026
The financial landscape for American households saw a significant expansion in the third quarter of 2025, according to the latest "Financial Accounts of the United States" report released today by the Federal Reserve. Data from the Flow of Funds report indicates that the aggregate net worth of U.S. households and nonprofit organizations surged by $6.1 trillion, reaching a new milestone of $181.6 trillion.
This substantial increase, driven primarily by a robust performance in the equity markets, highlights the complex interplay between rising asset valuations, shifting real estate trends, and the ongoing accumulation of household debt. While the headline figure suggests a broad-based improvement in financial standing, a deeper analysis of the data reveals a nuanced story regarding the composition of American wealth and the cooling of the housing market.
Main Facts: A Trillion-Dollar Quarter
The Federal Reserve’s Q3 2025 data paints a picture of a nation experiencing significant capital gains, largely decoupled from the cooling real estate sector. The $6.1 trillion increase in net worth—which aggregates financial assets and real estate, minus liabilities—was heavily skewed toward the stock market.
Specifically, the report highlights that the value of directly and indirectly held corporate equities increased by $5.5 trillion during the quarter. This surge in equity wealth acted as the primary engine for the net worth gain, offsetting a slight contraction in the total value of real estate, which fell by $0.3 trillion.
While wealth grew, the report also tracked a simultaneous rise in financial obligations. Household debt increased at an annualized rate of 4.1% in the third quarter. This was driven by a 2.3% annualized growth in consumer credit and a 3.2% annualized growth in mortgage debt. The juxtaposition of rising equity-led wealth alongside steady debt accumulation forms the central theme of the current economic cycle.

Chronology of the Q3 Financial Landscape
To understand the trajectory of these figures, one must look at the progression of the economy throughout 2025.
- Q1 2025: The year began with cautious optimism, as equity markets continued to show resilience despite high interest rates. Household net worth saw moderate gains as employment remained stable.
- Q2 2025: The second quarter was marked by a slight plateauing in real estate growth. Homeowner equity, which had been at record highs relative to historical averages, began to face pressure as mortgage rates influenced transaction volume.
- Q3 2025 (The Current Report): The third quarter witnessed a pronounced "wealth effect" driven by the equity markets. Despite the $0.3 trillion dip in real estate valuations, the $5.5 trillion gain in corporate equities ensured that the net worth of the American household sector reached the $181.6 trillion threshold.
This chronology illustrates a shift in wealth generation: the American economy is increasingly relying on the performance of financial assets rather than the appreciation of physical property to boost the balance sheets of households.
Supporting Data: Dissecting the Wealth Composition
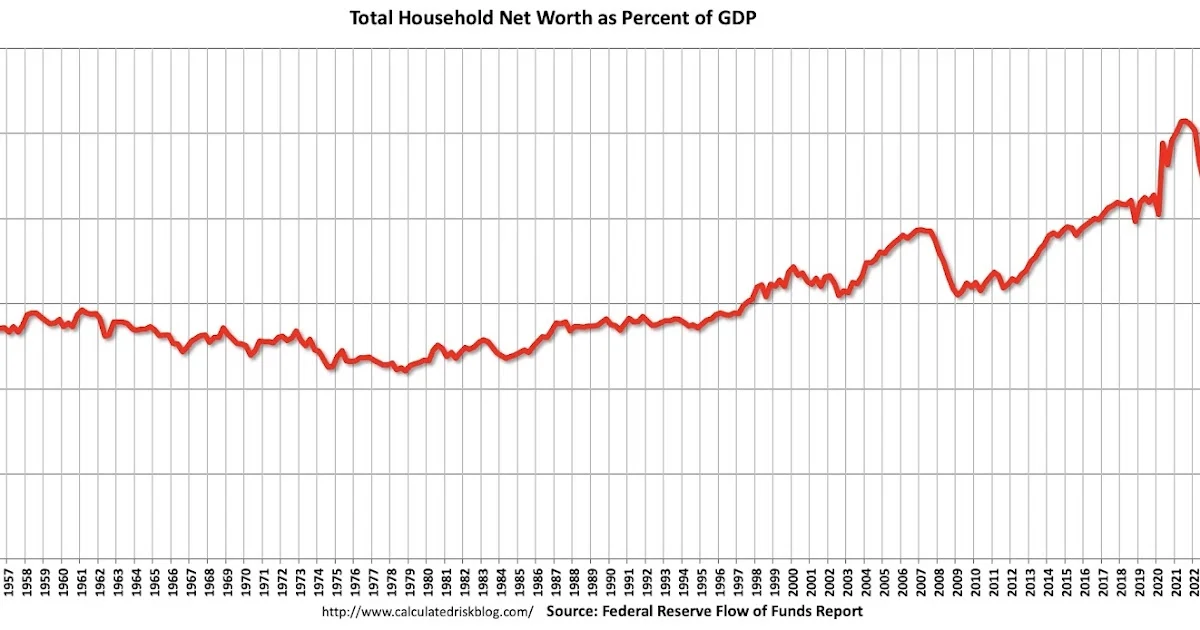
The Federal Reserve’s data provides several critical lenses through which to view these changes. By examining net worth as a percentage of GDP, analysts can determine whether wealth is growing in line with the productive output of the economy.
Net Worth as a Percent of GDP
While the absolute dollar value of net worth has climbed, the ratio of net worth to GDP remains a vital metric. As of Q3 2025, net worth as a percentage of GDP saw an increase, yet it remains below the historical peak observed in 2021. This indicates that while households are wealthier than they were a few years ago, the growth of personal assets has not yet reached the dizzying, record-breaking heights relative to the size of the national economy that were seen in the immediate post-pandemic era.
Homeowner Equity Trends
Perhaps the most scrutinized metric in the report is homeowner equity. Since the housing market crash of 2007–2008, economists have monitored this figure as a barometer for financial stability. In Q3 2025, household equity as a percentage of total real estate value stood at 71.6%, a slight decrease from 72.0% in Q2.
This decline suggests that while homeowners still possess significant equity, the combination of stagnant home price appreciation and the moderate growth in mortgage debt is slowly compressing the equity ratio. However, it is essential to note that this figure includes all households, including those who own their homes outright without a mortgage—a demographic that provides a significant buffer against market volatility.

Real Estate and Mortgage Debt
The third major data set involves real estate assets and mortgage debt as a percentage of GDP. Mortgage debt grew by $108 billion in the third quarter. While this number sounds substantial, it must be viewed in context. Although mortgage debt is approximately $2.99 trillion higher than it was during the peak of the mid-2000s housing bubble, it represents only 43.9% of GDP. This is a dramatic improvement from the 73.1% peak seen during the housing bust, suggesting that American households are far less leveraged against their real estate than they were during the last major financial crisis.
Official Responses and Economic Interpretations
While the Federal Reserve does not provide a narrative interpretation of its statistical releases, the data has sparked significant discussion among market analysts and government economists.
The primary takeaway from economic observers is the "resilience of the balance sheet." By keeping mortgage debt-to-GDP ratios at manageable levels, the American public has avoided the systemic fragility that characterized the 2008 financial crisis. However, some analysts warn that the dependence on equity markets for wealth creation creates a "fragile prosperity." If equity markets were to face a sharp correction, the impact on household net worth would be immediate and severe, given the current concentration of wealth in corporate securities.
The decline in real estate values, though minor, is being interpreted as a sign of a "market normalizing." Following years of runaway price growth, the cooling of the housing sector—marked by a lower real estate value-to-GDP ratio—is seen by some as a necessary correction that prevents the formation of a new, unsustainable bubble.
Implications for the Future
The implications of the Q3 2025 Flow of Funds report are multi-faceted, affecting everything from consumer confidence to future monetary policy.
1. Consumer Spending and the Wealth Effect
The "wealth effect"—the theory that people spend more when their portfolios rise—suggests that the $5.5 trillion gain in equities could bolster consumer spending in the final quarter of the year and into early 2026. Retailers and manufacturers are likely to view these numbers as a positive indicator for demand.

2. Monetary Policy Considerations
For the Federal Reserve, the data provides a complex backdrop. With household net worth hitting record highs and debt growth remaining controlled, the Fed has more breathing room to maintain current interest rate levels without fearing an immediate collapse in household solvency. However, the continued growth in debt—even if it is manageable—will be monitored closely to ensure that credit markets do not overheat.
3. The Shift from Real Estate to Financials
For decades, the "American Dream" was anchored to home equity. The data suggests that for the average household, the focus of wealth accumulation has shifted. With real estate assets as a percent of GDP showing signs of cooling and equity markets becoming the primary driver of net worth, financial literacy and access to capital markets are becoming more critical than ever for middle-class wealth preservation.
4. Risks and Vulnerabilities
Despite the positive report, risks remain. The exclusion of public debt from these figures is a reminder that while the private sector appears healthy, the broader national fiscal position is not reflected in these numbers. Furthermore, the volatility inherent in equity markets means that the $6.1 trillion increase is, in many ways, "paper wealth." Should market sentiment shift, the reversal could be just as rapid as the growth.
Conclusion
The Q3 2025 Federal Reserve Flow of Funds report confirms that American households are currently navigating a period of financial strength, underpinned by a resilient stock market and a housing sector that, while cooling, remains fundamentally sound. As the nation moves into 2026, the challenge for policymakers and households alike will be to maintain this momentum without over-leveraging or becoming overly reliant on the cyclical nature of the financial markets.
The $181.6 trillion figure stands as a testament to the growth of the U.S. economy, but it also serves as a reminder that financial stability is a delicate balance between asset appreciation and prudent debt management. As the data shows, the American household remains in a strong position, but the path forward will require continued vigilance against the inevitable fluctuations of the global economy.