Executive Summary: A Surge in Financial Prosperity
The financial landscape for American households saw a significant expansion in the third quarter of 2025, according to the latest "Financial Accounts of the United States" report released by the Federal Reserve. Data indicates that the collective net worth of households and non-profit organizations rose to a staggering $181.6 trillion. This $6.1 trillion increase was primarily fueled by a robust rally in equity markets, which offset a marginal cooling in the residential real estate sector.
While the headline figure suggests a period of broad-based economic prosperity, the report also highlights the shifting dynamics of debt and leverage within the American consumer base. As we move into 2026, analysts are scrutinizing these figures to determine if the wealth effect—the phenomenon where consumers spend more as their assets appreciate—will continue to serve as a primary engine for the U.S. economy.
Chronology of the Q3 2025 Financial Expansion
The trajectory of household net worth throughout 2025 has been defined by a volatile yet ultimately upward trend.
- Early 2025: Entering the year, households faced a complex environment characterized by fluctuating interest rates and cooling inflation. Initial reports suggested that while wage growth remained steady, the primary driver of net worth was the stabilization of asset prices.
- Mid-2025 (Q2): The second quarter set the stage for the growth seen in Q3. Homeowner equity reached a peak level, and consumer debt levels were closely monitored by the Federal Reserve’s Board of Governors as they navigated monetary policy adjustments.
- The Q3 Surge: The period spanning July through September 2025 saw a distinct bifurcation in asset performance. While the real estate market experienced a slight contraction in total value—dipping by $0.3 trillion—the stock market’s performance acted as the primary catalyst for the $6.1 trillion increase in net worth. Directly and indirectly held corporate equities surged by $5.5 trillion, reflecting investor confidence in corporate earnings during the late summer and early autumn months.
Supporting Data: Dissecting the Balance Sheet
To understand the health of the American household, one must look beyond the headline number and analyze the underlying composition of assets and liabilities.
The Equity Component
The primary engine of growth in Q3 was the equity market. With corporate stocks accounting for the bulk of the $6.1 trillion gain, households with exposure to retirement accounts and brokerage holdings saw their net worths rise significantly. This underscores a trend observed throughout the early 2020s: the increasing reliance of American wealth accumulation on the performance of the S&P 500 and other major indices.

Real Estate: A Shift in Momentum
Real estate, traditionally the largest component of household wealth for the middle class, saw a slight decline in the third quarter. The $0.3 trillion decrease in total real estate value, when measured against GDP, suggests a market that is undergoing a period of correction or consolidation. Despite this, the long-term outlook remains stable.
The Debt Landscape
The report reveals a cautious increase in consumer obligations. Household debt grew at an annual rate of 4.1% in Q3 2025. This growth was distributed across:
- Consumer Credit: Expanding at an annual rate of 2.3%, suggesting a continued, albeit moderate, reliance on credit cards and personal loans.
- Mortgage Debt: Growing at an annual rate of 3.2%. While this adds to the overall debt burden, it is essential to view this through the lens of GDP. At 43.9% of GDP, mortgage debt remains significantly below the historical peaks seen during the 2008 housing crisis, which reached 73.1%.
Equity Percentages
One of the most vital metrics for homeowners is "percent equity." In Q3 2025, this figure stood at 71.6%, a slight decrease from the 72.0% observed in Q2. While a drop, it remains historically high, indicating that the majority of American homeowners possess significant cushions against potential price volatility.
Official Perspectives and Economic Context
The Federal Reserve’s release of the Z.1 report serves as a benchmark for economists, policymakers, and institutional investors. Unlike other economic indicators that focus on monthly fluctuations, the Flow of Funds report provides a quarterly snapshot of the total U.S. balance sheet.
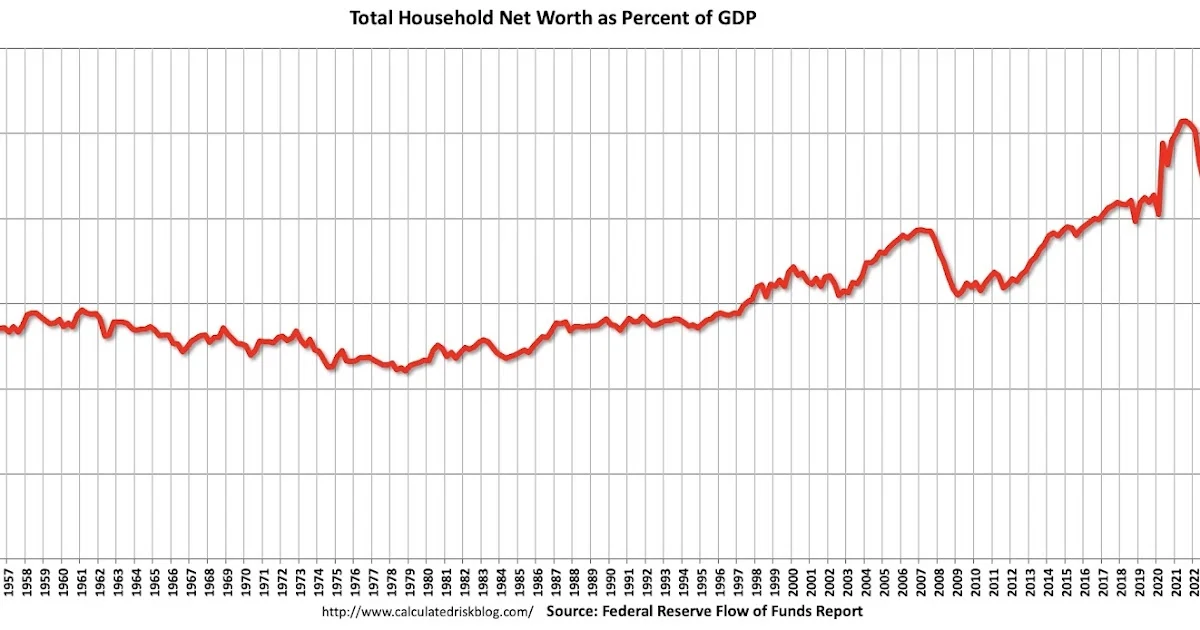
Financial analysts noted that while net worth has reached new heights, it remains slightly below the peak as a percentage of GDP observed in 2021. This suggests that while absolute wealth is increasing, the economy has yet to fully return to the exuberant valuations seen during the post-pandemic recovery era. The Fed’s data confirms that households are managing debt more conservatively than in previous decades, a trend that could provide a buffer against future economic shocks.

Implications: What This Means for the U.S. Economy
The data presented in the Q3 2025 report has several profound implications for the future of the U.S. economy.
1. The Wealth Effect and Consumer Spending
As household net worth climbs, the "wealth effect" typically encourages increased consumer spending. With $6.1 trillion added to the balance sheets of households and non-profits, there is potential for continued robust consumption. However, the Federal Reserve will be watching closely to see if this spending leads to inflationary pressure, which could influence future interest rate decisions.
2. Debt Sustainability
The moderate growth in mortgage and consumer debt suggests that households are not over-leveraging themselves in the current environment. By keeping debt-to-GDP ratios well below the highs of the mid-2000s, American households are displaying a level of financial discipline that was largely absent leading up to the Great Recession. This is a positive indicator for long-term financial stability.
3. Inequality and Wealth Distribution
While the report provides an aggregate view, it does not detail the distribution of this wealth. The increase in equity values primarily benefits those who are already invested in the market—typically households in the upper income brackets. Policymakers will likely continue to debate whether the current growth trajectory is broad-based enough to improve the financial standing of lower- and middle-income families, or if the wealth gap is continuing to widen.
4. Housing Market Resilience
Despite the $0.3 trillion decline in real estate value, the fact that homeowner equity remains at 71.6% is a testament to the resilience of the housing sector. High equity levels provide a safety net for homeowners, reducing the risk of widespread foreclosures even if property values were to face further downward pressure.

Conclusion: A Balanced Outlook for 2026
As we process the Q3 2025 Flow of Funds data, the overarching takeaway is one of relative health. The American household has proven remarkably resilient, bolstered by a strong stock market and prudent debt management. While the cooling of the real estate sector and the slight dip in equity percentages serve as reminders of the inherent volatility in the economy, the total net worth of $181.6 trillion provides a solid foundation for the year ahead.
Looking forward, the interaction between interest rates, consumer debt appetites, and corporate performance will dictate the direction of household wealth in 2026. For now, the U.S. consumer appears to be on firm footing, balancing the benefits of asset appreciation with a disciplined approach to liabilities. As always, the Federal Reserve’s ongoing monitoring of these accounts will be the primary source for understanding the shifting sands of American financial life.