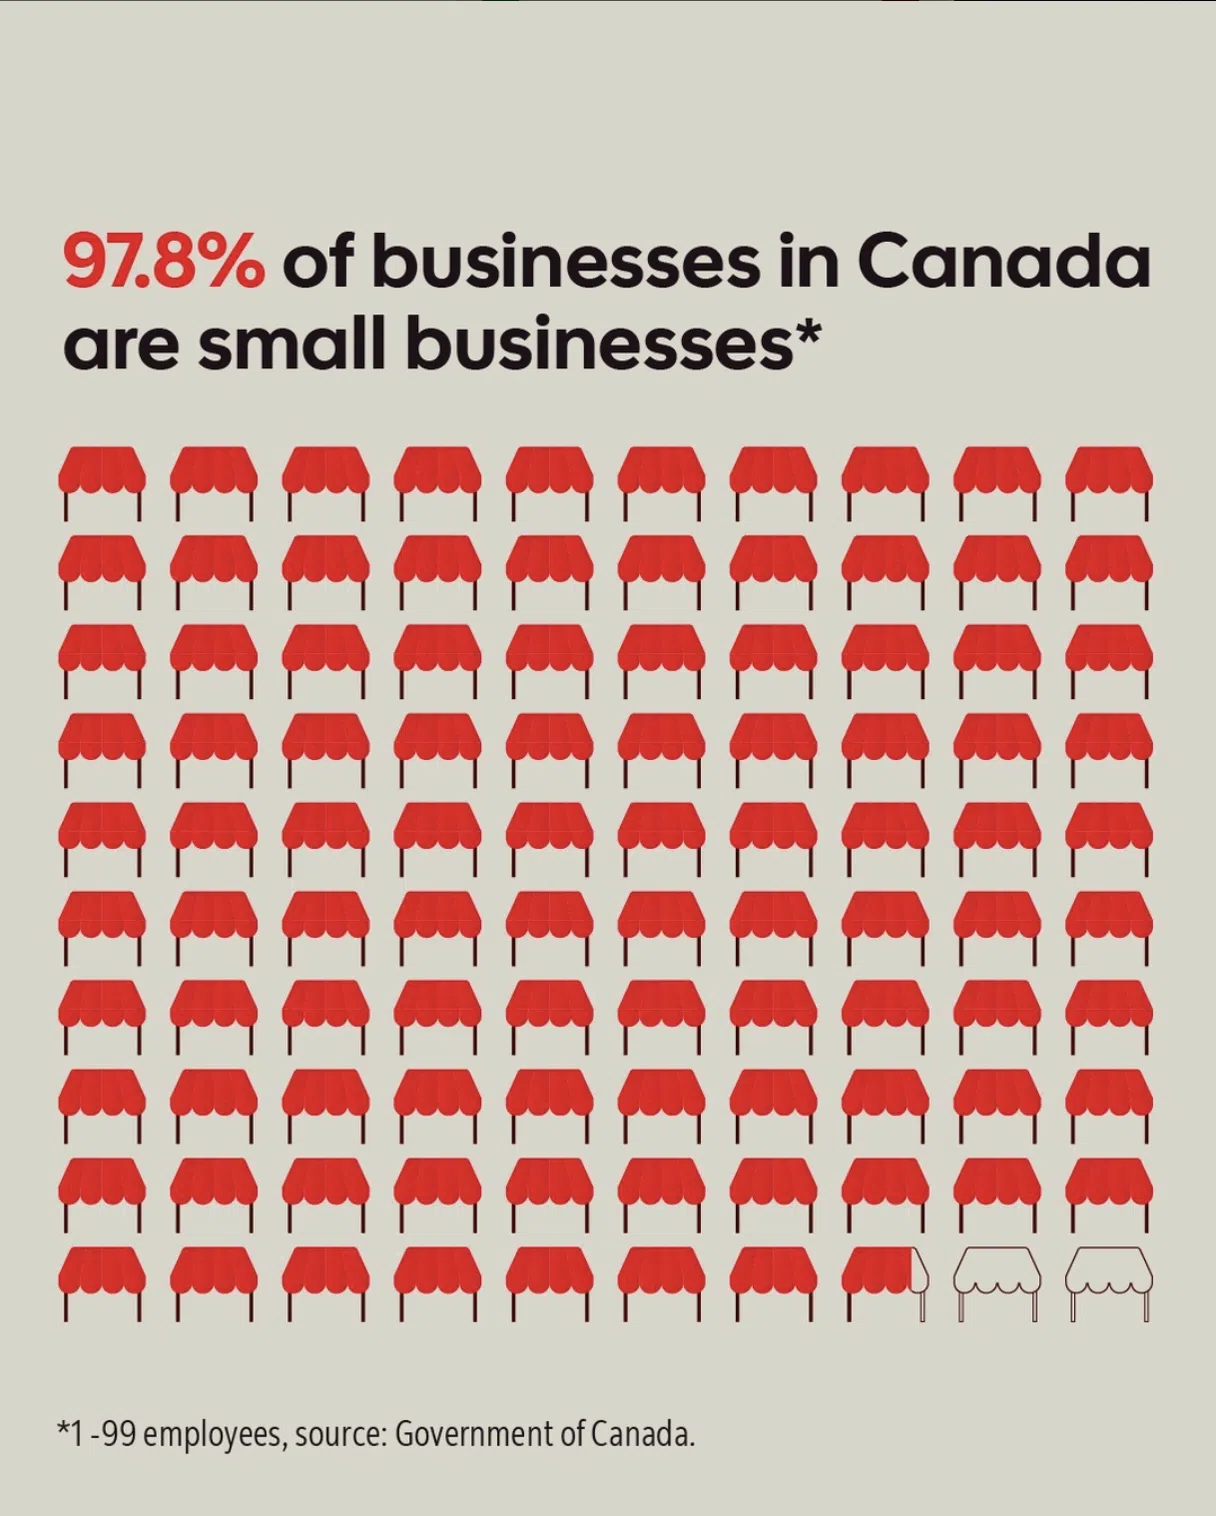
In an era defined by information saturation, the difference between a brand that captures attention and one that fades into the algorithmic background often comes down to one critical skill: data storytelling. As social media platforms move away from purely aesthetic content toward value-driven insights, the ability to translate raw numbers into compelling narratives has become a prerequisite for modern marketing success.
Data storytelling is more than just posting a chart; it is the strategic practice of using facts, statistics, and quantitative analysis to build a narrative that is both understandable and actionable. When executed correctly, it bridges the gap between cold logic and human emotion, allowing brands to establish authority and trust in a digital landscape often plagued by misinformation.

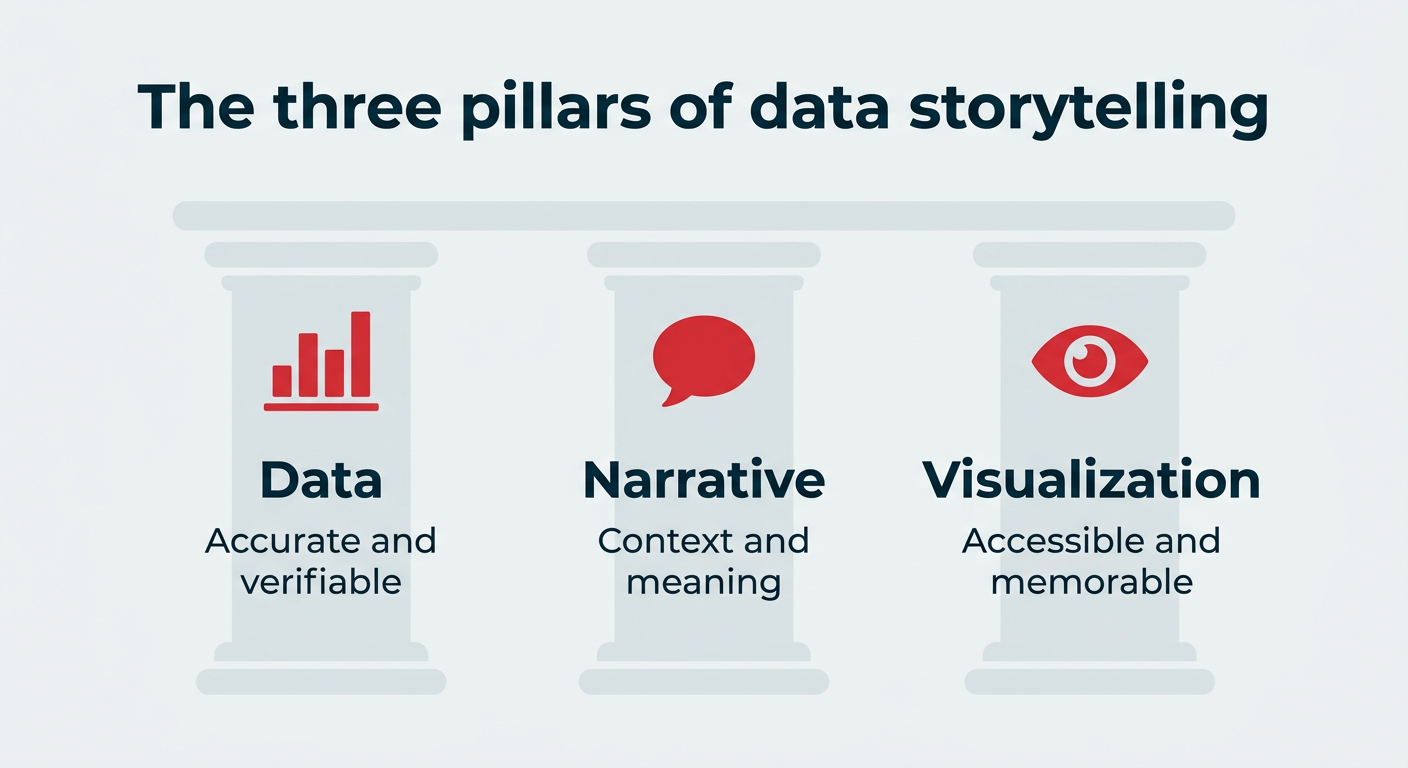
The Three Pillars of Data Storytelling
For any data-driven narrative to succeed, it must rest upon a foundation of three distinct pillars: Data, Narrative, and Visualization. If any of these elements are missing, the content inevitably falls flat. Data without a narrative is merely a dry list of figures; a narrative without data lacks credibility; and visuals without substance are nothing more than decorative filler.
1. Data: The Foundation of Trust
Your data must be accurate, relevant, and, above all, verifiable. Whether you are leveraging third-party research, platform-specific analytics, or your own first-party sales data, the source must be beyond reproach. In a climate where 79% of adults globally express concern regarding the manipulation of information via social media, transparency is a brand’s greatest asset. If you cannot cite the origin of a statistic, it has no place in your content strategy.

2. Narrative: The Human Connection
Narrative provides the "why." It offers the necessary context, establishes the stakes, and dictates the takeaway. A 15% growth rate is an arithmetic fact until it is framed within a story about overcoming industry obstacles or expanding access for customers. Narrative is the mechanism that transforms a static statistic into a shareable experience.
3. Visualization: Processing at Speed
The human brain processes visual information significantly faster than text. In a social media feed characterized by rapid scrolling, your visualization—whether it be a single-stat graphic, a bar chart, or an interactive carousel—must communicate the core message instantly. As Leeann Froese, Digital Marketing Manager at Town Hall Brands, notes, “The brain processes visual information much faster than text,” making the choice of format just as important as the data itself.
The 5 C’s Framework: Structuring Your Data Narrative
To prevent your posts from becoming uninspired lists of figures, adopt the "5 C’s" framework. This classic narrative structure ensures your data-driven content has a clear beginning, middle, and end.
- Context: Set the stage. Why does this number matter right now? Frame the trend, season, or business problem that necessitates the data.
- Characters: Who is affected? Whether it is your customers, your community, or your internal team, the audience needs a human anchor to relate to.
- Conflict: Identify the tension. What is the gap, the risk, or the missed opportunity that the data reveals?
- Climax: This is your "hero" statistic—the turning point that reframes the issue and provides the crucial insight.
- Closure: The resolution. Provide a clear, actionable call to action (CTA) that tells the audience exactly what to do next.
Chronology of a Successful Data Story
A successful data campaign follows a logical, seven-step progression that ensures both accuracy and emotional impact.
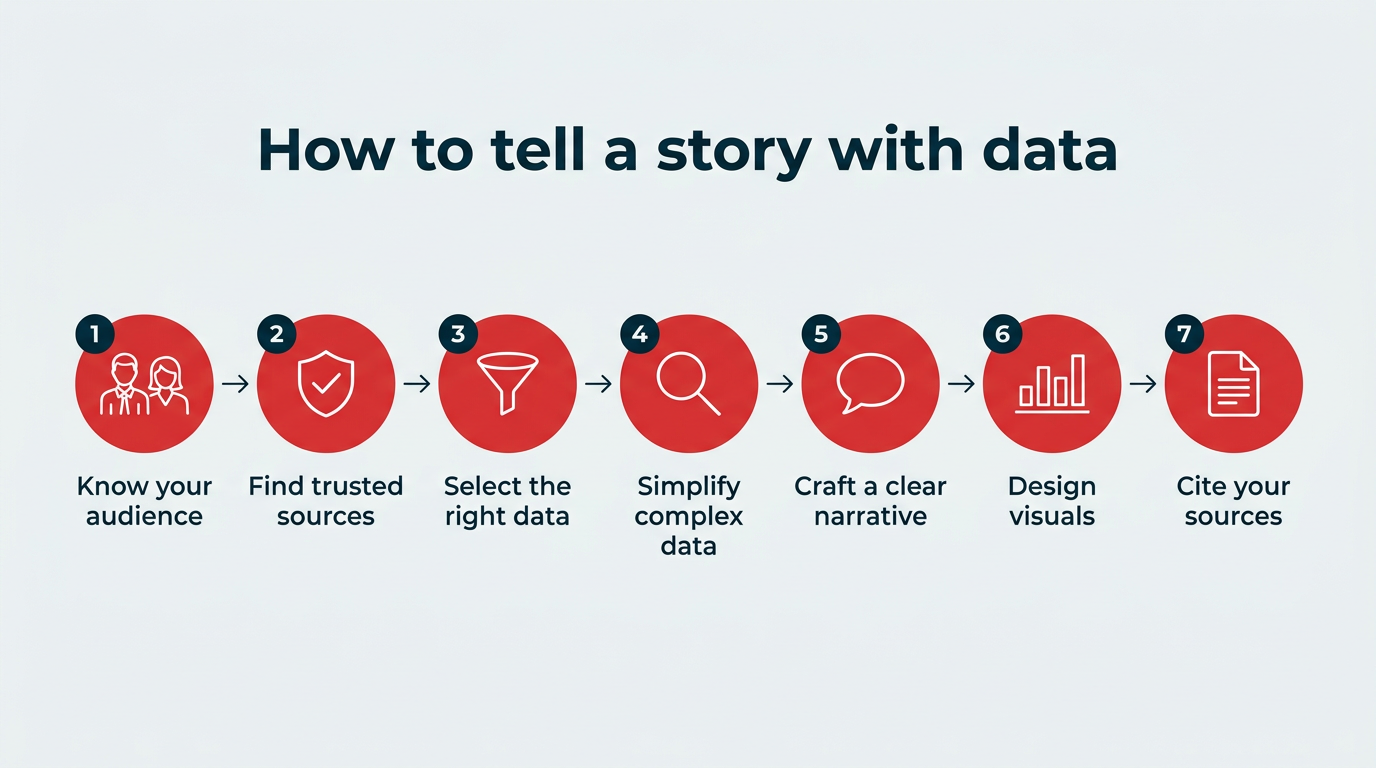
- Identify Your Audience: Before selecting a single data point, determine who you are speaking to. A financial stakeholder requires a different level of detail compared to a general consumer.
- Source Verification: Always prioritize peer-reviewed research or proprietary data. Avoid pulling figures from unverified social media accounts.
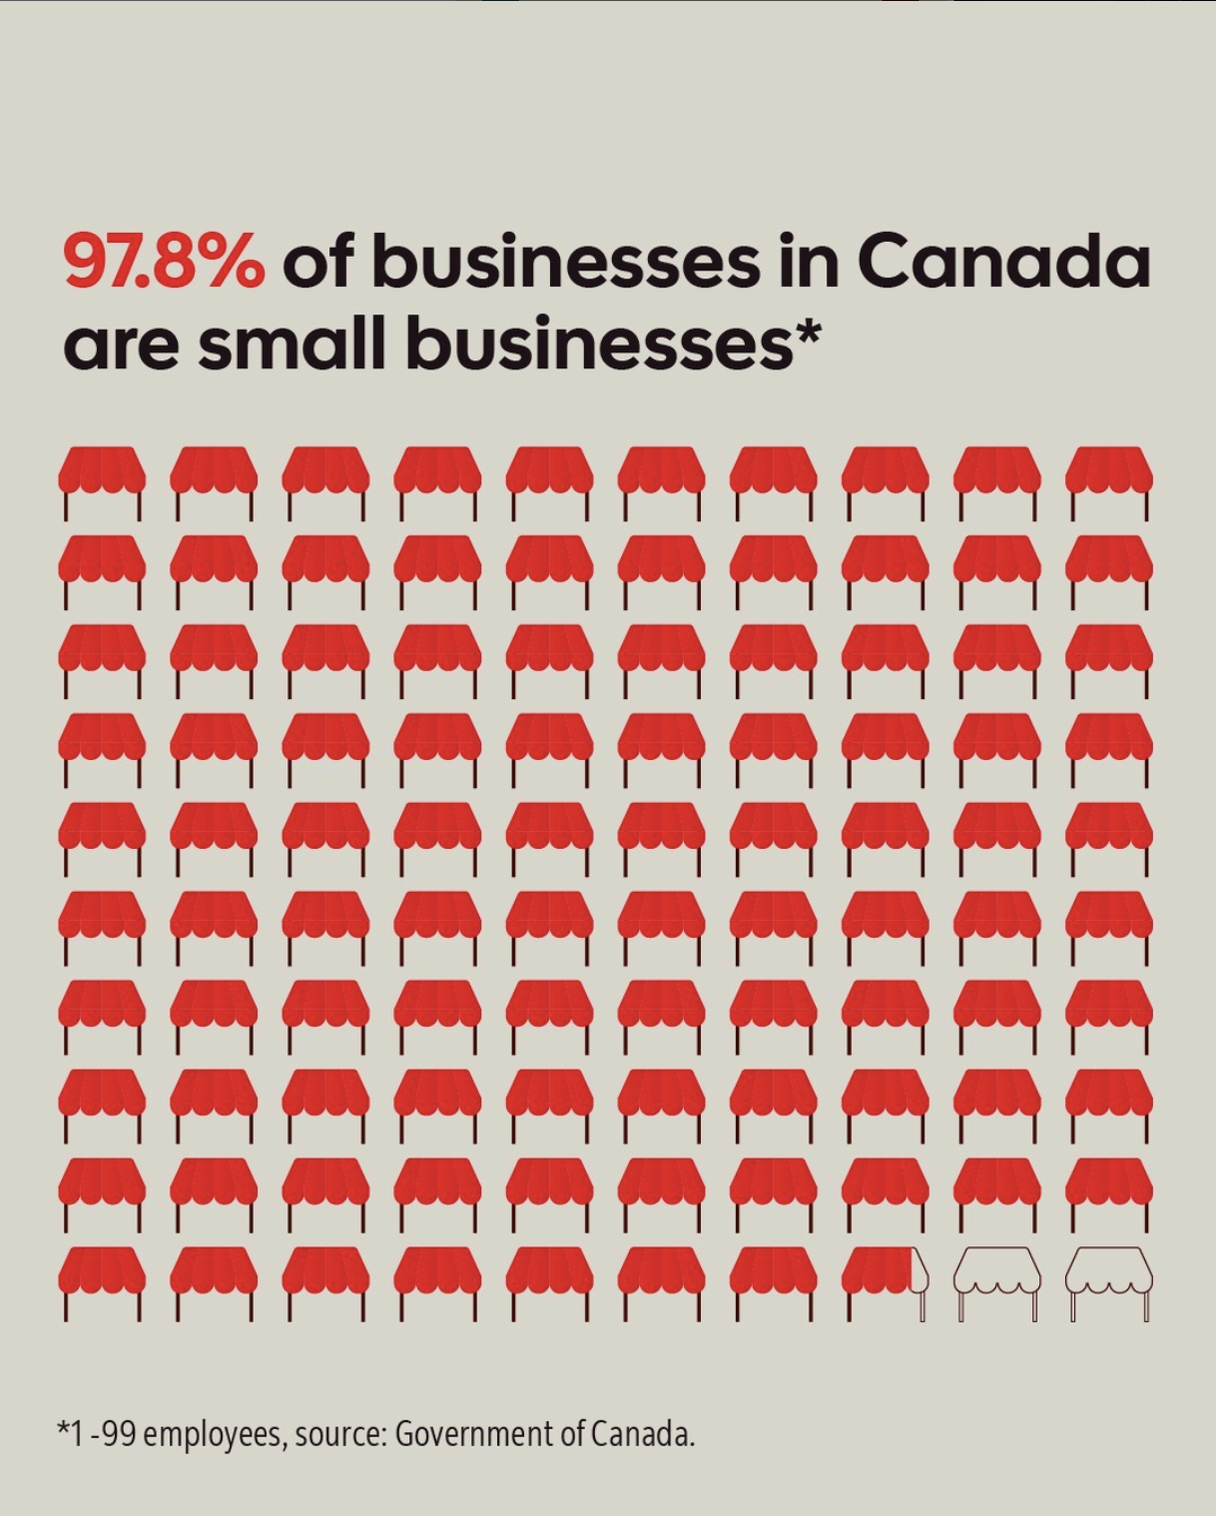
- Selective Curation: Less is more. Choose the one or two data points that directly serve your narrative. Pinterest’s "Trend Forecasts" serve as a gold standard here, curating massive datasets into highly specific, actionable themes.
- Simplification: Convert complex units into relatable analogies. Instead of stating "10,000 liters of production," consider framing it as "enough to fill 10,000 glasses."
- Narrative Integration: Weave the data into the story. Introduce the context, drop the statistic at the climax, and conclude with a purpose-driven CTA.
- Visual Design: Utilize platform-specific formats. Use carousels for deep dives and high-contrast, single-stat graphics for fast-paced feeds like Instagram or X.
- Transparent Citation: Always credit your sources. If you feel hesitant to reveal where a number came from, it is a sign that the data requires more verification.
Supporting Case Studies: Data in Action
The Emotional Impact (Dove’s "Hard Knocks")
Dove’s campaign surrounding body confidence is a masterclass in using data as a "reality check" rather than a hook. By beginning with home-movie-style clips of girls playing sports, the brand builds emotional rapport. The reveal—that 45% of girls quit sports by age 14—acts as a jarring, powerful conclusion that drives the viewer toward a specific mission.
The "Scroll-Stopper" (Farmers Pick)
On TikTok, where retention is measured in seconds, Farmers Pick utilizes "shock data." By leading a video with the statistic, "1,500kg of zucchinis rejected by supermarkets," they immediately hook the viewer with a visual of food waste. This demonstrates how a single, provocative data point can drive thousands of comments and meaningful engagement.

The Community Recap (OG Slimes)
Brands can also leverage the "Spotify Wrapped" model. By sharing annual sales data in a visually satisfying, recap-style format, brands like OG Slimes turn proprietary performance data into community-focused content that celebrates the customers’ own behaviors.
Implications and Strategic Benefits
Why should a brand commit to this level of rigor? The benefits extend far beyond vanity metrics.
Building Brand Authority
In a digital marketplace where misinformation is rampant, data-led content acts as a badge of credibility. By consistently sharing verified, transparent insights, you position your brand as a thought leader rather than a megaphone.
Enhancing Performance Visibility
Data-led posts provide clearer performance signals. When you structure a post around a specific statistic, it becomes significantly easier to measure success based on audience resonance rather than vague reach metrics. This allows social media managers to report meaningful ROI to leadership, proving that social strategy contributes to tangible business outcomes.
Driving Engagement in a Saturated Market
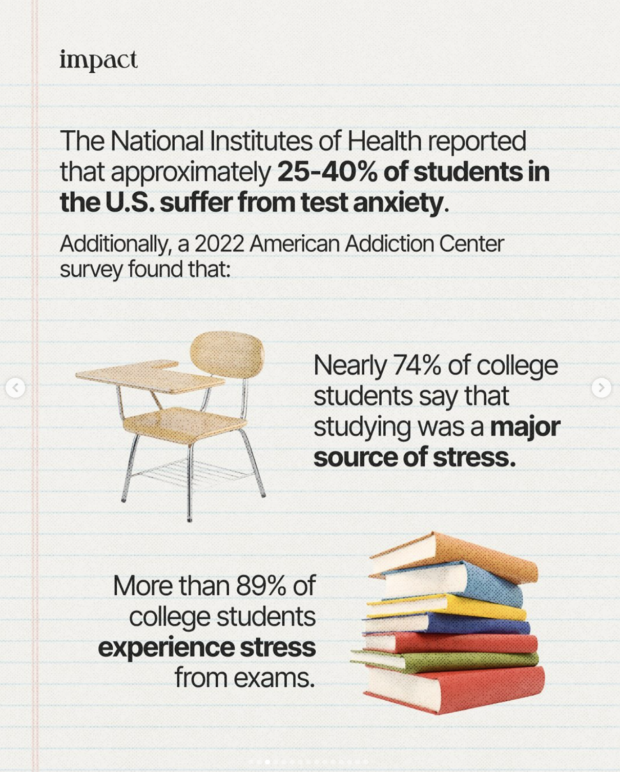
With median engagement rates on platforms like Instagram trending downward (recently dipping toward 9.7%), meaningful stories are the only way to cut through the noise. Data provides the "proof" that today’s skeptical consumers demand. It turns the social media feed from a place of superficial scrolling into a destination for learning and discovery.
Avoiding Common Pitfalls
As you integrate data into your strategy, remain vigilant against common failures:

- The "Data Dump": Never overwhelm your audience with too many numbers. Stick to one core insight per post.
- Ignoring the Context: Data without a story is meaningless. Always ensure the "why" is explicitly stated.
- Chart Incoherence: Avoid decorative 3D effects or complex visualizations that distort proportions. If the chart requires a manual, it’s too complicated for social media.
- The Missing CTA: Never leave your audience hanging. After providing the insight, tell them where to go next—whether that is your website, your blog, or a specific product page.
Ultimately, data storytelling is an opportunity to connect, inspire, and differentiate. By moving away from superficial content and embracing the precision of data-driven narrative, brands can build deeper, more resilient relationships with their audiences. In the crowded market of 2026, the brands that win are those that don’t just tell their audience what to believe—they show them the proof.