Ethereum (ETH), the world’s leading smart-contract platform, has found itself locked in a high-stakes tug-of-war between bearish liquidation pressures and opportunistic long-positioning. After weeks of relative stability, the asset has recently experienced a breakdown of its technical structure, triggering a cascade of liquidations that have left investors questioning whether the current price action represents a definitive floor or a precursor to further downside.
Main Facts: The Anatomy of the Recent Correction
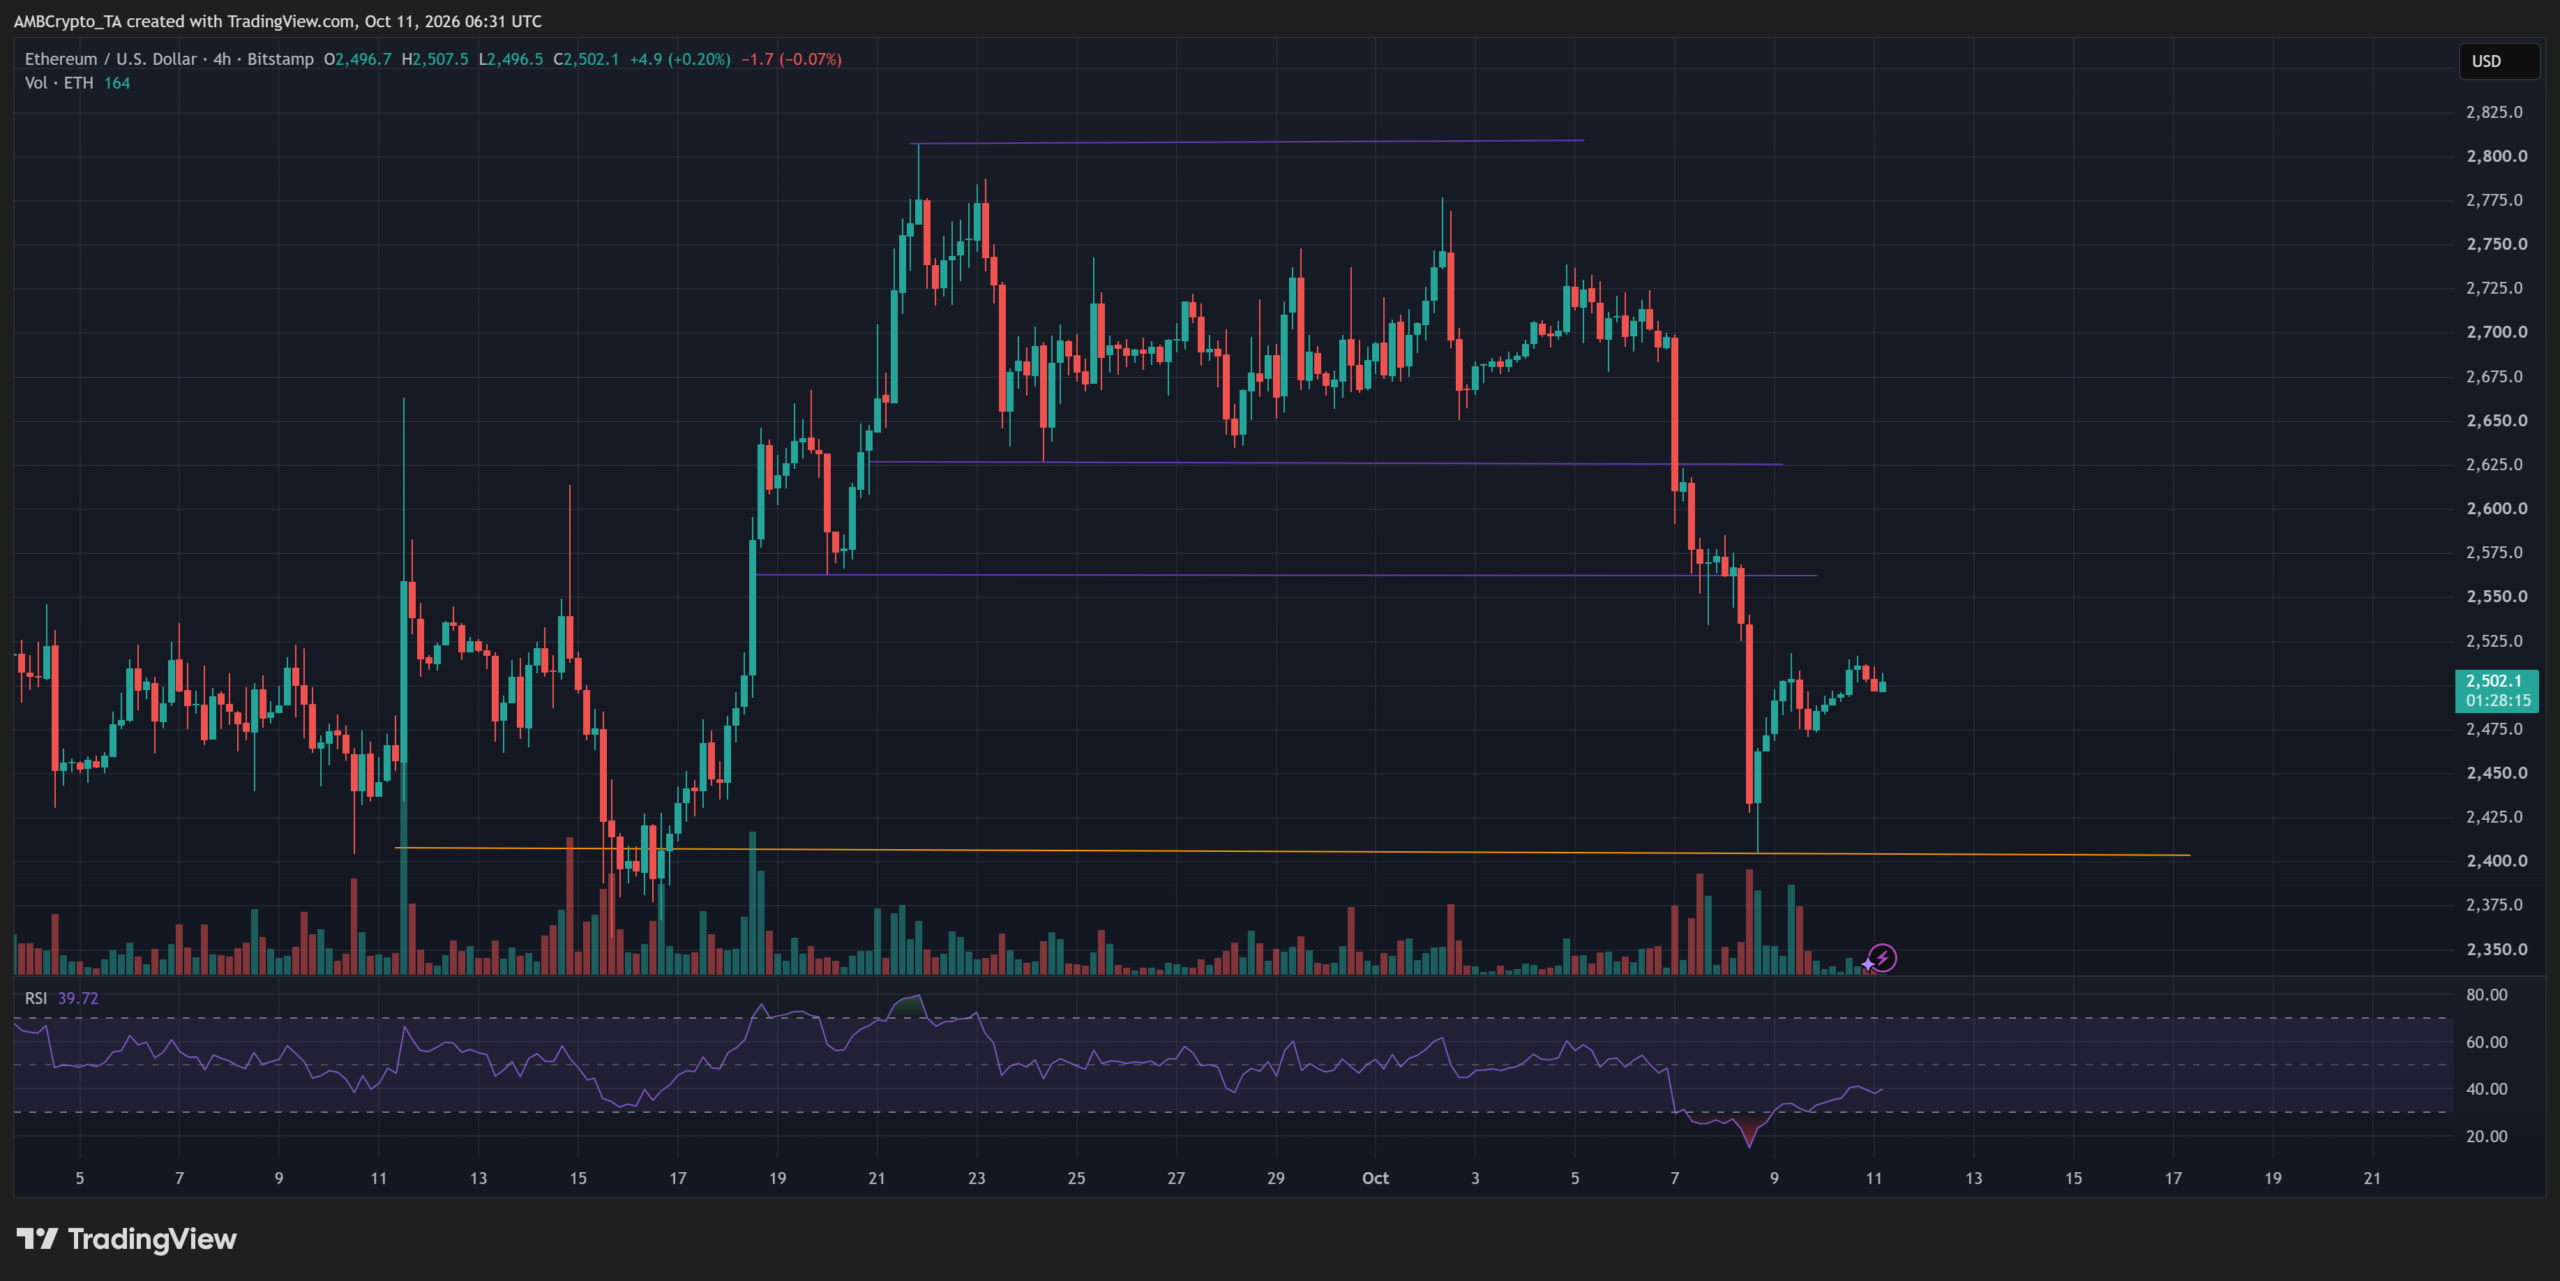
The narrative surrounding Ethereum over the past few days has been defined by the failure of critical support levels. Having spent the latter half of September trading within a defined range, Ethereum’s technical stability crumbled when the price breached the $2,250 support level. This breach was not merely a minor dip; it acted as a catalyst for a sharper downward trajectory, fueled by a wave of sell-side pressure that exhausted the existing buy-side liquidity.
The sell-off intensified until the asset found a temporary, albeit fragile, equilibrium near $2,400. This level served as the launchpad for a tactical rebound, which saw the altcoin climb back above the psychological $2,500 threshold, hitting a local peak of $2,519. However, the recovery has been met with immediate resistance, as the momentum required to sustain a push toward higher resistance levels has remained conspicuously absent.
Currently, the market is defined by a lack of conviction. While the price has recovered, the trading volume on the spot market remains sluggish, suggesting that the rebound is largely driven by derivative speculation rather than genuine, sustained accumulation.
Chronology: A Week of Market Turbulence
The recent volatility in the Ethereum market can be broken down into three distinct phases:

- The Breakdown (Late September – Early October): For several weeks, Ethereum held onto its range-bound structure, providing a sense of security for traders. However, the pressure finally mounted as the $2,250 support failed to hold after two days of consistent test-runs by sellers. This breakdown effectively invalidated the previous trading range and signaled a shift in market control toward the bears.
- The Liquidation Flush: As the price dropped, the market witnessed a rapid succession of liquidations. Leveraged long positions—traders who had borrowed capital to bet on an upward move—were forced to exit their positions, creating a “long squeeze” effect that accelerated the decline. This phase bottomed out near $2,400, where the selling pressure finally encountered enough counter-buying to pause the descent.
- The Stalled Recovery: The current phase is characterized by a tentative recovery. Having reclaimed the $2,500 level, Ethereum is struggling to build on its gains. Market participants are watching the $2,408 level closely; should the price fail to hold here, analysts warn of a re-test of the $2,350–$2,400 zone. Conversely, a breakout above $2,560 could act as a catalyst for a move toward $2,625, potentially restoring bullish confidence.
Supporting Data: Why Sentiment is Turning Negative
Beyond the raw price action, underlying market data paints a complex picture of risk and reward.
ETF Outflows and Spot Demand
One of the most concerning metrics for long-term investors is the sustained lack of demand for Ethereum spot ETFs. Weekly data shows persistent, heavy outflows—totalling approximately $542 million. This consistent exit of capital from institutional-grade investment vehicles suggests that the "smart money" is currently wary of ETH exposure. When demand from these major conduits remains weak, the price of the underlying asset becomes significantly more vulnerable to retail-driven volatility.
Derivative Positioning and Open Interest
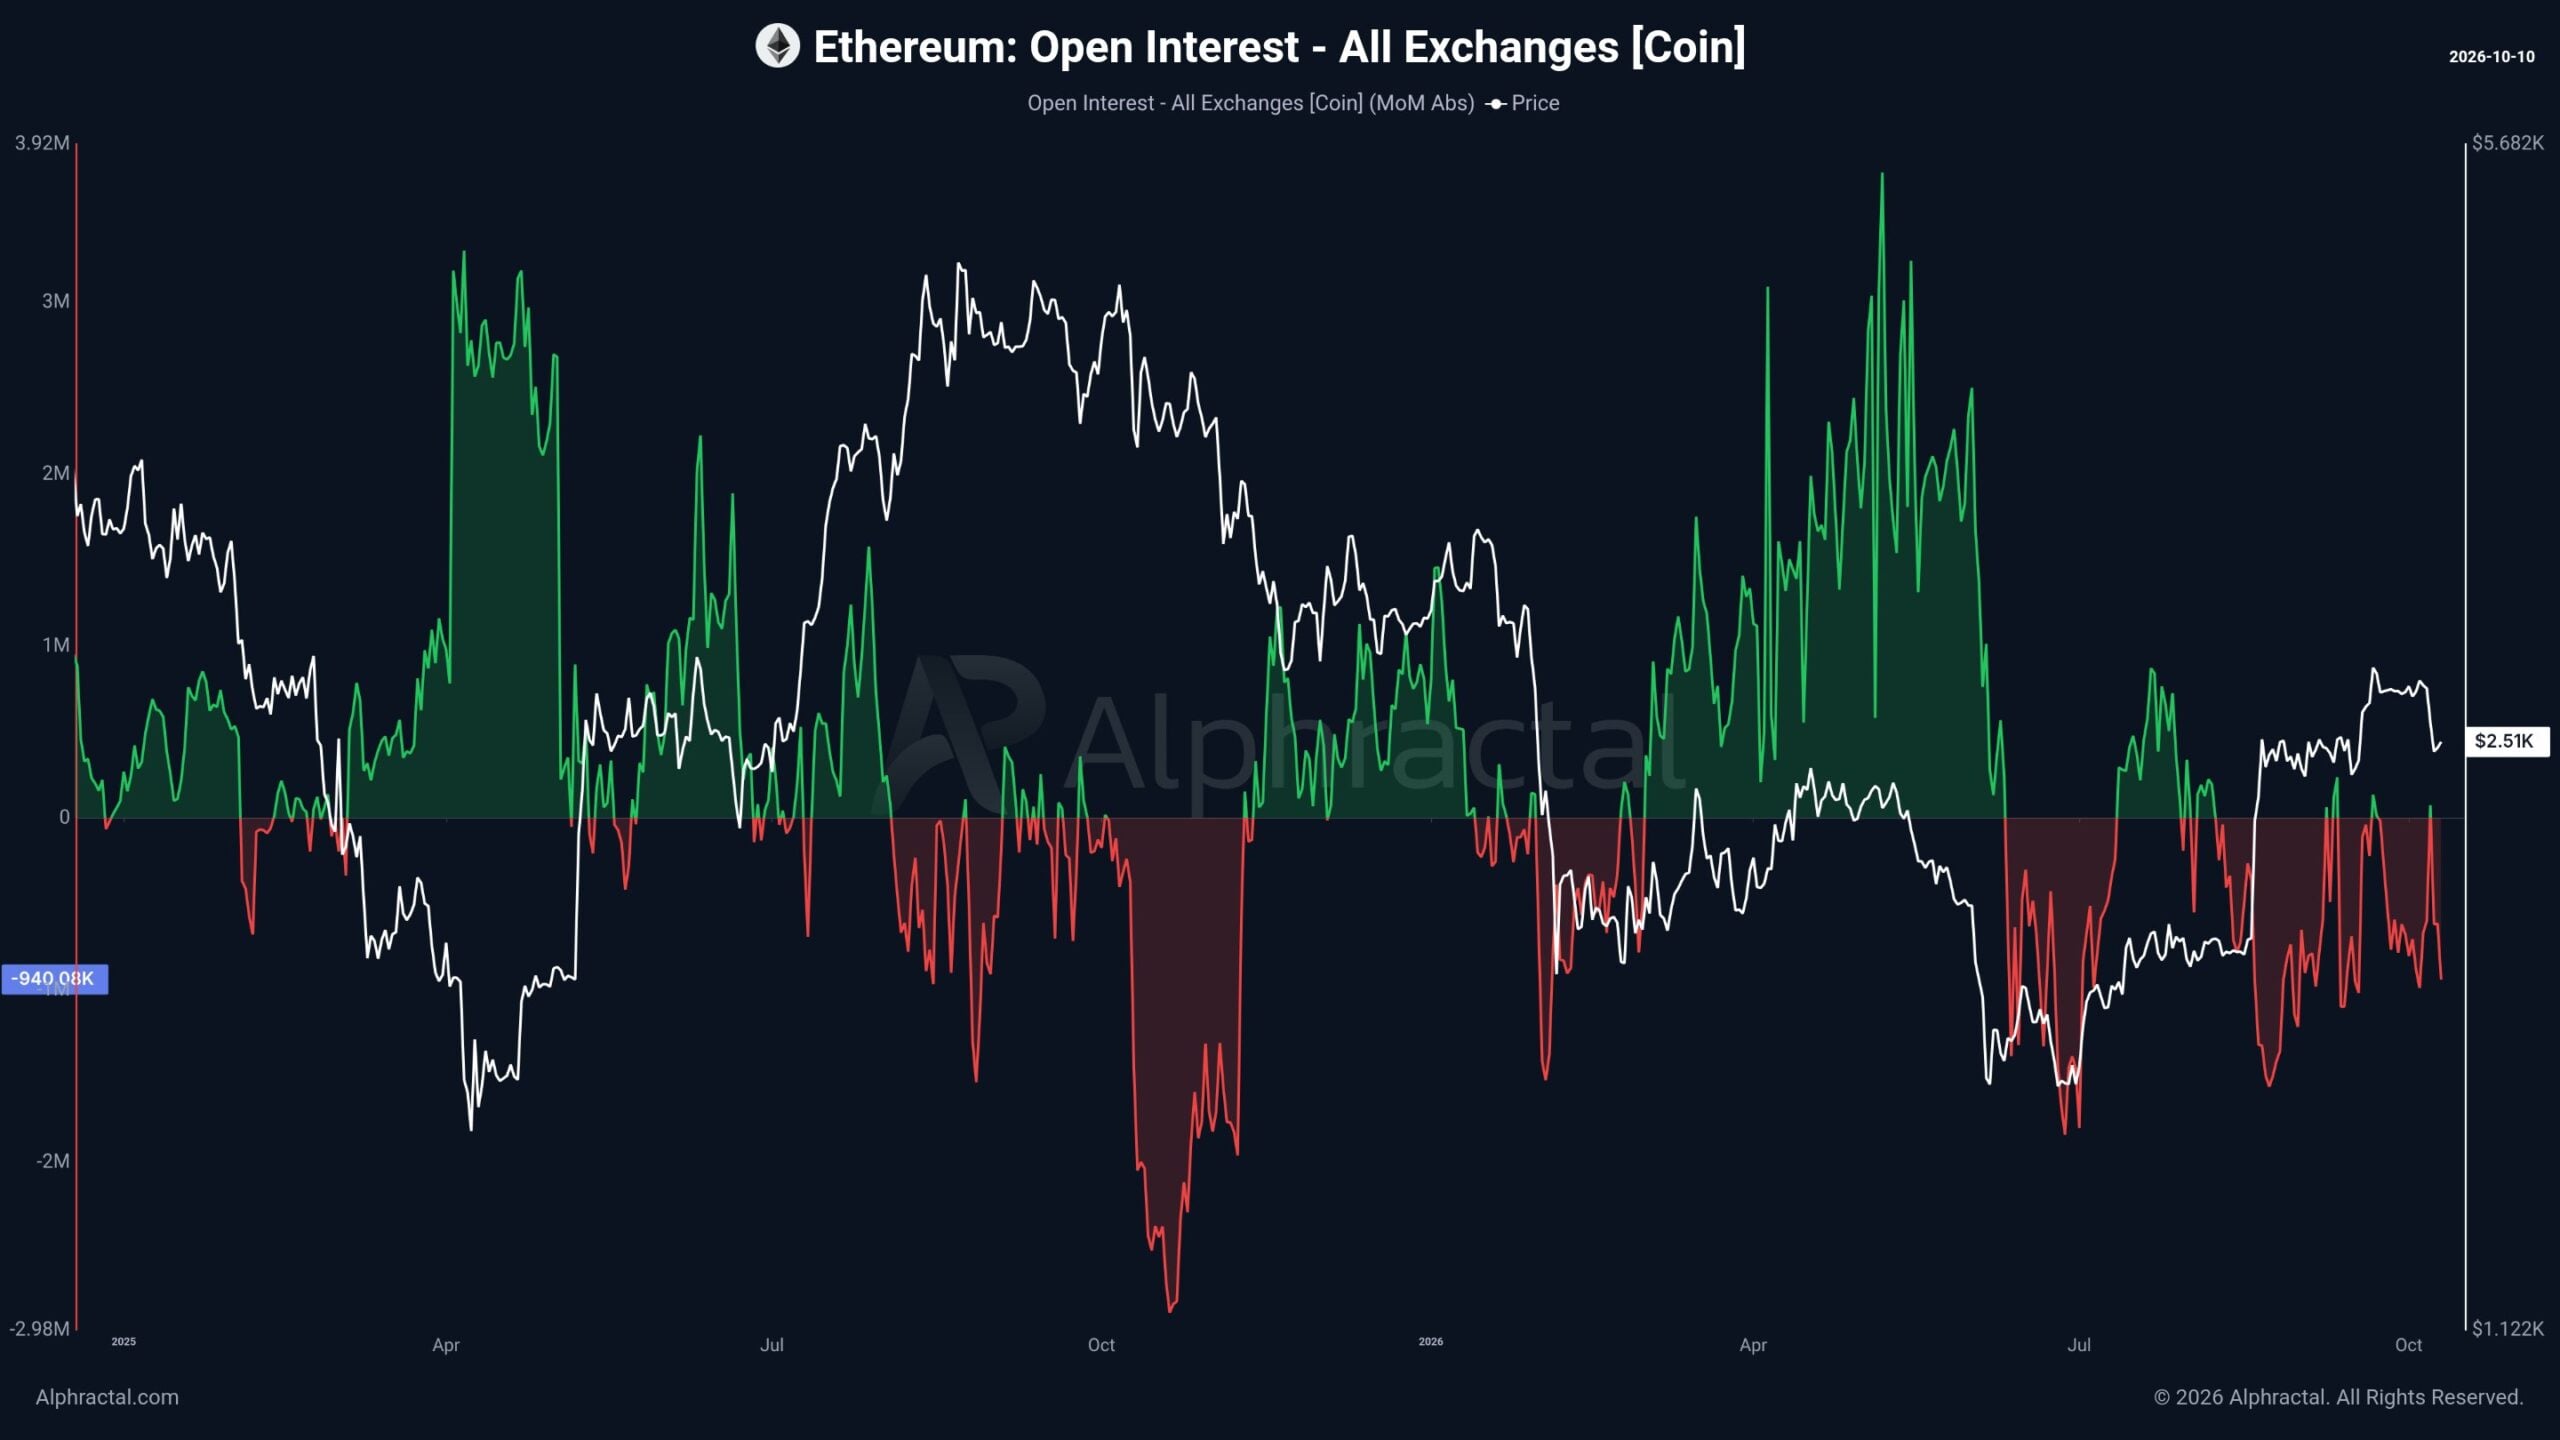
The derivative landscape is equally precarious. Data from the analytics firm Alphractal reveals that confidence among major traders is currently in a state of decay. Both the 30-day and 180-day open interest deltas are in negative territory, signaling that the long-term appetite for leveraged exposure is waning.
Perhaps most telling is the "Whale vs. Retail" delta. With this metric also remaining negative, it implies that larger, more sophisticated players—often referred to as whales—are not currently engaging in aggressive buying. In contrast, retail traders appear to be attempting to "catch the falling knife." With roughly 10.58 million ETH (approx. $12.9 billion) still tied up in open interest, the market remains a powder keg. If the price experiences a sudden, sharp move in either direction, the sheer volume of leveraged capital at risk could lead to massive, cascading liquidations.
Strategic Divergence: The Bitfinex Anomaly
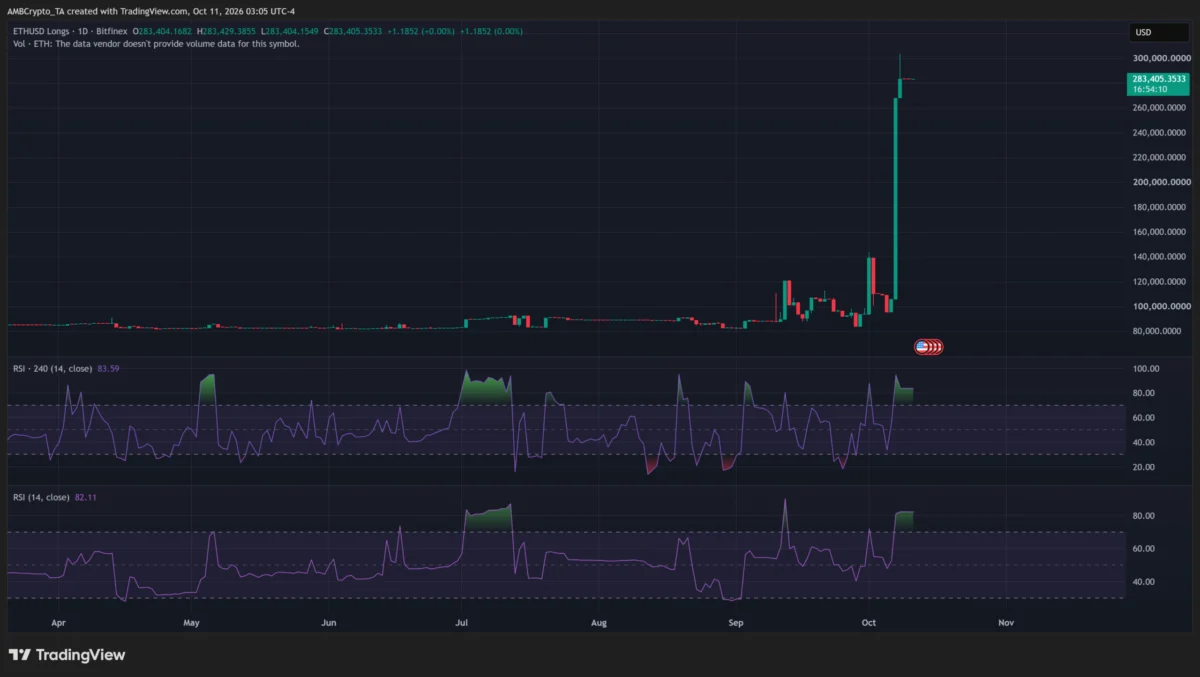
Despite the prevailing bearish indicators, not every corner of the market is retreating. A notable surge in long positions has been recorded on the cryptocurrency exchange Bitfinex. Long positions on the platform have climbed to nearly 283,405 ETH, suggesting that a significant cohort of traders views the recent price crash as an undervalued entry point rather than a signal to exit.
However, this contrarian bet is fraught with danger. The Relative Strength Index (RSI) on the ETH/USD chart has climbed above 82, placing it firmly in "overbought" territory. In technical analysis, an RSI reading above 80 is a strong signal that an asset is overextended and may be due for a sharp correction or, at the very least, a period of cooling off. The divergence between the general market sentiment—which remains cautious—and the aggressive accumulation on Bitfinex suggests a high-risk gamble that relies heavily on a swift market reversal.
Implications for the Future: Navigating the $2,400 – $2,600 Range
The path forward for Ethereum depends on which market force wins the battle for the $2,500 pivot point.
The Bearish Scenario
If the current recovery proves to be a "dead cat bounce," the implications are clear: the market will likely test the lower bounds of $2,350. Continued liquidation of leveraged long positions would likely follow, creating a feedback loop of selling that could further depress prices. Without a catalyst to reignite institutional demand (such as a reversal in ETF flow data), Ethereum remains susceptible to macro-economic headwinds and sector-wide risk-off sentiment.
The Bullish Scenario
For a sustained recovery, the bulls must reclaim and hold the $2,560 level. Achieving this would do more than just improve the technical chart; it would signal a return of demand and likely trigger a short-covering rally, where those who bet on the decline are forced to buy back in to limit their losses. A move toward $2,625 would likely serve as the psychological tipping point required to shift the 30-day and 180-day open interest deltas back into positive territory.
The Institutional Reality
Ultimately, the primary implication of the current data is that Ethereum’s price discovery is being hampered by a lack of institutional conviction. As long as the ETF outflows persist, the market will remain reliant on the volatile swings of derivatives traders. Investors should note that until the "whale vs. retail" delta flips positive, the risk of a "liquidation trap" remains high.
Conclusion: A Market in Transition
Ethereum stands at a precarious juncture. While the resilience shown by the rebound above $2,500 provides a glimmer of hope for the bulls, the underlying data—characterized by negative open interest deltas and persistent ETF outflows—suggests that the market is far from out of the woods.
The next few days will be critical. Traders and long-term holders alike are advised to monitor the $2,408 support level with extreme vigilance. In a market where leverage is high and conviction is low, volatility is the only certainty. Whether this serves as the foundation for a late-year rally or merely a temporary pause in a larger correction remains the central question for the Ethereum ecosystem. For now, the "smart money" seems content to wait on the sidelines, leaving the market in the hands of those willing to navigate the choppy waters of high-leverage speculation.